 Ryszard Romaniuk
580 California St., Suite 400
San Francisco, CA, 94104
2019, Compressed Baryonic Matter experiment at FAIR - Progress Report 2018
https://doi.org/10.15120/GSI-2019-01018An experimental project like CBM necessarily comprises a vast number of activities in many different areas: research on detector technology, development of readout electronics and components for data acquisition, computing and software tools for data processing and physics analysis, and many more. The series of annual CBM Progress Reports, started back in 2006, was intended to collect and document these manifold activities. Browsing through the past volumes unfolds a large spectrum of scientific work in the process of the realization of the project: fromconceptual studies over thoroughR&Dto the implementation and testing of prototypes. This CBM Progress Report 2018 continues along these lines. Its contents, however, reflect that some six years before the planned start of data taking, the CBM project is undergoing a gradual transition. The long period of planning and R&D is giving way to the large-scale production and integration of detector hardware, a process to be finished by 2024, when the CBM apparatus is expected to be commissioned in its experimental area. An important step towards this realisation of the experiment is the full-system test setup mCBM, allowing to study the joint in-beam operation of several detector systems and the read-out and data processing, following the ambitious CBM concept of free-running data acquisition. Further important technological experience is gained by the deployment of CBM detector systems at running experiments: TOF in STAR, RICH in HADES, PSD in BM@N. These detector operations will contribute important technological expertise for the preparation of the full CBM experiment. We hope this reports conveys some of the enthusiasm of the CBM collaboration in the realization of a technologically very challenging experimental project which promises a rich physics output once taking data. Our thanks go to all who have contributed to this report: the reviewers, who helped getting it into shape, and all authors having delivered the actual content. Darmstadt, October 2019 Volker Friese and Ilya Selyuzhenkov, editors

![The exploration of the QCD phase diagram in the regio! of high baryon densities is the primary goal of the physic program of the Compressed Baryonic Matter (CBM) expe iment at FAIR. During 2018 the collaboration faced a de tailed evaluation in the context of the FAIR project revie that was successfully passed with the arguments presente below. Figure 1: Rate capabilities as function of collision energy of existing and planned experiments (Figure adapted from [1]).](https://figures.academia-assets.com/61158213/figure_002.jpg)


![Figure 1: Average hit number per frame vs. sensor ID for an Au+Au (upper) in comparison to a p+Au reaction, shown for all four station half sides, assuming left-right stations geometry. In conclusion, the results presented and detailed in [1] pro- vide firm estimates for planning the number of GBTx chips employed by MVD, as well as e.g. designing the layout of the electrical feed-throughs of the target chamber front plate. They are based on the projected MIMOSIS r/o ar- chitecure and geometrical dimension, considering the nom- inal interaction rates for AA and pA reactions and conceiv- ably reduced mgn. field.](https://figures.academia-assets.com/61158213/figure_006.jpg)

![The MVD [1] is the vertex silicon pixel detector of the CBM experiment, placed closest to the target and in front of the STS. Based on our current knowledge, we have been working on a realistic MVD CAD model that could help in joining forces resulting in a common understanding of the MVD environment, see Figure 1, the target volume and the installation process.](https://figures.academia-assets.com/61158213/figure_008.jpg)


![Table 2: Statistics on the identified defects of the tested CBM sensors for mSTS. The total amount of bad strips per sensor per side is well below the required acceptance limit of 1.5% for the CBM- STS [2] except for the sensor with ID number 5552-301 where all 27 bad strips belong to the p side of the sen- sor. However, the sensor is fully operational and still can be used for module assembly in mSTS. Because implant](https://figures.academia-assets.com/61158213/table_002.jpg)


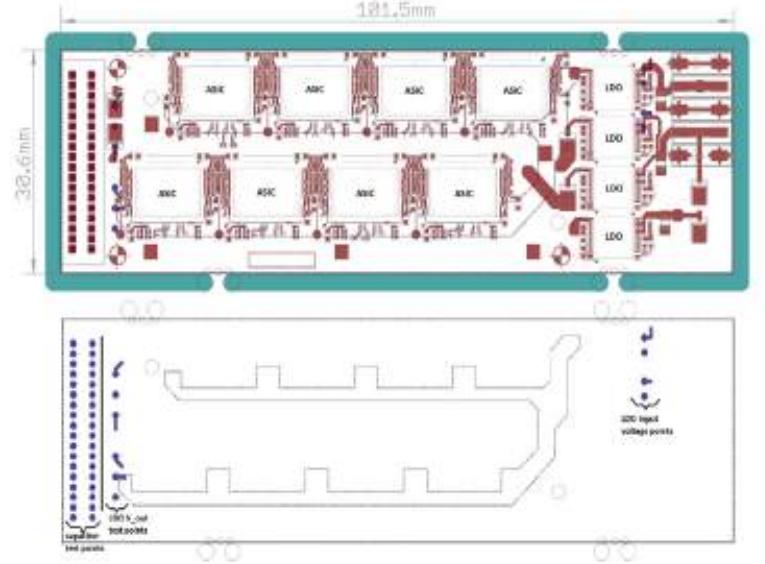


![The assembly of the first detector modules is a crucial step towards the realization of the STS. In the framework of the mCBM project, the STS will contribute with two track- ing stations using a total of 13 detector modules. These are built with 6.2 x 6.2 cm? sensors and micro cables of approximately 45 cm length. Every sensor is readout by two prototype frontend boards witch 8 STS-XYTER ASICs each (FEB8). Further details on the assembly and quality assurance are given in [1]. Figure 1: Fully assembled module before its installation in the mSTS setup.](https://figures.academia-assets.com/61158213/figure_037.jpg)


![Three PCBs with 4 LVRs each had been delivered from Semi-Conductor Laboratory Chandigarh/India [1] for mea- surements and irradiation tests. The LVRs on the boards were supplied pairwise with V;,, and the load on the output side was chosen such that at V.,,, = 1.8 V the output current was set to around 1.4 A. The Enable pin was set to GND in all cases so that chips were active and could be observed continuously (in Fig. 1 for a pair of ASICs). Figure 1: Thermal image of one of the three PCBs under test with only two LVR chips active. The resistor traces reached more than 60°C without cooling.](https://figures.academia-assets.com/61158213/figure_051.jpg)
![Figure 2: Proton beam homogeneity measured with GAFCHROMIC EBT QD+ film and scanned on a densit- ometer. Within the area of LVRs the deposited dose was homogeneous to within + 5%. and connected to a PTW UNIDOS [3] device, which was read out outside of the experimental hall. The LVR de- vices were all irradiated in an active state and their output monitored during all the irradiation. Beam homogeneity (depicted in Fig. 2) was proven by means of Gafchromic EBT QD+ film [4] (blue insert) which was scanned on a densitometer after irradiation. The proton dose varied not more than +5% within an area of 28 mm in diameter. The PCBs were connected to the power supply with a 1.5 mm? thick cable to reduce the voltage drop on the input channel. Additional sense wires were used to monitor the Vj, (of chip pairs) and V,.,, of every chip continuously during the irradiation runs. Every parameter was registered also in a log file, what allows for an analysis of the chips’ behavior before, during and after the exposure.](https://figures.academia-assets.com/61158213/figure_052.jpg)


![Figure 2: Loaded mirror supporting frame prototype with indication of the micrometers positions (left). Right: Mi- crometers for measuring horizontal (No. 5) and vertical displacements (No. 7). Next, all components for a full-scale prototype [2] of the mirror supporting frame were manufactured, tested [3] and assembled (Fig. 2). Tests were carried out on the deforma- tion and stability of the structure.](https://figures.academia-assets.com/61158213/figure_071.jpg)
![Figure 1: Small frame design model (above), photo of the produced frames with imitations of the mirror tiles (bot- tom). A lightweight aluminum full-scale prototype of the mir- ror supporting frame for the CBM RICH detector [1] was produced and tested this year. As a first step, in order to further reduce the amount of materials in detector accep- tance, lightweight small frames and six mounts were pro- duced and tested with mirror tile imitators (Fig. 1).](https://figures.academia-assets.com/61158213/figure_072.jpg)


![Two such real-size (~80 cm x ~ 40 cm) trapezoidal shaped triple GEM chambers using NS-2(glue-less) tech- nique were fabricated and tested with the Fe®° source at VECC. These modules were installed in the mCBM[3] ex- periment at GSI. Fig.3(a) shows the test setup at VECC. The Fe spectra obtained from this detector is shown in Fig.3(b). Figure 1: Left: Drift PCB and HV layout. Right: Zoomed picture of optocouplers](https://figures.academia-assets.com/61158213/figure_098.jpg)


![Straw tube detectors are considered as the option for the 3-rd and 4-th stations of CBM Muon Chamber [1]. The full size octagonal straw module prototype has been produced and tested at LHEP JINR [2]. The straw detector with the rectangular shape [3] can be also used at CBM to reduce the cost and to improve the quality of the muon tracker.](https://figures.academia-assets.com/61158213/figure_121.jpg)

![Figure 1: Front-end electronics PCB. Front-end electronics board for straw tube detector with 32- charge- sensitive amplifiers based on AST-1-1 chip [2] is shown in Fig.1. These chips are specially designed to read the signals from straw detectors. Each AST-1-1 chip processes signals from eight straw tubes providing eight LVDS outputs to the TDC.](https://figures.academia-assets.com/61158213/figure_123.jpg)


![Figure 1: Measured Efficiency with respect to high voltage using commercial CSA 142]H. The prototype bakelite RPC has shown > 95% efficiency in detecting cosmic muons at 10.5 kV [1] using the follow-](https://figures.academia-assets.com/61158213/figure_131.jpg)
![kV. The charge sepctra of the detetctor has also been mea- sured at 9.8 kV using MANAS based electronics [2] and the maximum measured charge was ~ 270 fC as shown in Fig.2. Figure 2: Measured Charge Spectrum using MANAS DAQ.](https://figures.academia-assets.com/61158213/figure_132.jpg)


![Figure 1: Mass distribution of wrongly identified 4 He for 10’ simulated UrQMD-events with embedded 3H and d. For the identification of ,%He, which decays as ,$He —+ >He + p+ and subsequently as He > *He + p + 7, the separation of d and “He is particularly important. In fact, without clearly separating these two nuclei, it is not possible to distinguish the ° He-decay from the decay of the hypertriton: {He + d+p+77~. As the expected production rate of 3H (1.7 -10? per central Au-Au colli- sion at 8 AGeV [3, 4]) is significantly higher compared to the production rate of ,¢He (4.8-10~® per event), a high background is expected. Figure 1 shows the distribution of wrongly identified He (in blue) in 10” simulated UrQMD- events, each containing one 3H and six d [4], but neither aHe nor ,¢He. With a TOF mass-cut Am= +3 o around the 5 He-mass (in violet) the number of wrongly identified ‘He is around 1,000. The TRD provides a suppression of nearly all misidentified 5 He (in orange). At the same time, the efficiency « = Teh [estore i.e. the ratio of correctly identified particles nM@° sig. to simulated](https://figures.academia-assets.com/61158213/figure_147.jpg)


![Figure 2: Maximum ADC value plotted against the ADC value of sample[31] for self or neighbour triggered mes- sages on all channels (Xe/CO2(80:20), Anode HV = 2000 V).](https://figures.academia-assets.com/61158213/figure_150.jpg)
![Figure 3: Baseline positions (upper panel) and widths, determined as 20 of the Gaussian fit (lower panel) of channel 6 determined by Gaussian fits for the sample[0], sample[1] and sample[31] methods plotted against time (Xe/CO2(80:20), Anode HV = 2000 V). beam for half of the time recored in these files. As a TSA file is limited in data size and not in time of recording, these three files span over longer time than the other files, as indi- cated by the larger horizontal error bars. Why the baseline position and especially its width drops significantly at a PE- TRA III top-up is not yet fully clear. While it could also be a reconstruction artefact, it would otherwise suggest a load dependence, though a verification of this is non-trivial. If a higher load, quantified by an increased hit rate, would raise baseline position and width, so would a raised base- line position and width increase the hit rate, as absolute thresholds were used. For a disentanglement of these two effects, more refined measurements and analysis have to be conducted. A test setup, specifically for in depth baseline measurements, is currently being installed in the laboratory in Miinster.](https://figures.academia-assets.com/61158213/figure_151.jpg)
![Figure 4: Baseline positions (upper panel) and widths, de- termined as 2c of the Gaussian fit, (lower panel) of the channels 4 to 7, calculated with the sample[0] method plotted against time. The channels 4 and 6 were lo- cated in the beam spot, the channels 5 and 7 outside of it (Xe/CO2(80:20), Anode HV = 2000 V). have very similarly to each other, one can conclude that the baselines of neighbouring pads are correlated. As chan- nel 4 and 6 were located in the beam spot, thus receiving higher statistics, they have generally less statistical fluctu- ations, but are affected more strongly by the PETRA top- ups. Generally, the width of the baseline needs to be re- duced substantially to achieve the design value. We note that a good detector energy resolution was measured in the lab with a °°Fe source [3].](https://figures.academia-assets.com/61158213/figure_152.jpg)
![The most inner 10 TRD modules of each layer of the TRD wall in the CBM experiment are exposed to of particles often in pile-up regime. To disentangle individ- ual hits and reconstruct incident position and energy de- posit, the Bucharest-prototype is designed around two fea- tures: triangular-shaped pad-plane for 2D position sensitiv- ity and non-diagonal self-triggered singled-value read-out ASIC - FASP (Fast Analog Signal Processor) [1 mal data load. An almost exact replica of the C ules wil be installed in the mCBM setup [2] at S high rates for opti- BM mod- S18. The prototype of 59 x 59 cm? with 2880 readout channels is operated For the by 180 FASPs mounted on 30 FASPRO boards. mCBM experiment a new FASP version (v03) is prepared and a 6-FASPs FASPRO (FASP Read-Out) board has been produced and tested (v02). Figure 1: The third version of the FASP ASIC prepared for mCBM test in the design phase (left) and after bonding and ready for integration (right).](https://figures.academia-assets.com/61158213/figure_153.jpg)


![Figure 2: The data flow of GETS for CR detection with emphasizes on different type of messages and their time correlation. an error code wrt. to ADC reading (here 0 no error). The message is followed by 9 other signal messages which are very similar to it as far as the t/ and data are concerned. This identifies a pulser event of synchronous, quasi-equal signal values in all channels (see Fig. 1 bottom). Since both FASP had data during current epoch, an epoch message is issued at the end (see label ’messEpoch”). Following the pulser signal the data flow contains a reading of 4 signal messages issued by FASP id = 0 on 4 adjacent channels and having the similar time-label t] = 124. This is identi- fied as a cluster produced by a CR. Since the cluster is fully contained in FASP 0 only its epoch message is send. The epoch counter of both FASPs is reset at the value 2097151 (to be compared with the epoch counter of the first CR hit 1860169 and last 130926). The ’super epoch message” is issued there and the ’super epoch counter” S Epoch is in- cremented. Last 6 messages are a second CR hit happening with 5 signal messages and the corresponding epoch mes- sage at the end.](https://figures.academia-assets.com/61158213/figure_159.jpg)
![The Self-triggered Pulse Amplification and Digitization asIC (SPADIC) [1] is the centrepiece of the Front-end Elec- tronic Boards (FEB) [2] and responsible for digitizing the analog signals coming from the detector. On a TRD mod- ule, up to 20 SPADICs are connected via e-links to a Read- out Board (ROB) which aggregates the data streams and sends them via optical links towards the Data Process- ing Board (DPB). The DPB processes the data of multiple ROBs by a high performance FPGA. Figure 1: Data acquisition chain of the final experiment along with the data format used at different stages.](https://figures.academia-assets.com/61158213/figure_160.jpg)


![In October 2018, measurements with CBM-TRD MWPCs have been conducted at the CERN Gamma Irra- diation Facility (GIF**) [1], during which the detectors have been exposed to the y flux of a 14TBq 1°"Cs source and 1 beam at the same time. Two modules were aligned in 1:1 coverage with respect to the passing js beam. As yp ref- erence counter, two scintillators of the GIF have been used, which are permanently installed outside the GIF cave and thus are shielded from the GIF source irradiation field, but passed by the ys beam only. A third scintillator has been in- stalled directly in front of the TRD MWPCs, matching the active (recorded) area of the tested detectors. A sketch of the different detectors is shown in Figure 2.](https://figures.academia-assets.com/61158213/figure_166.jpg)


![The TRD will deliver particle identification crucial for the investigation of rare dilepton channels and will be able to separate charge states for the hypernuclei program. For the best understanding of the detector it is necessary to sim- ulate all effects as realistic as possible, in order to get the best overview of all expected performances and possible is- sues. By implementing the front-end electronic algorithms in the simulation it is now possible to study all detector as- pects in more detail. Since the Monte-Carlo information generated by Geant only contains the total charge deposi- tion, but does not calculate the ionization at specific po- sitions inside the gas volume, this has to included in the digitization step, e.g. to account for statistical fluctuations in the ionization process. The charge is now distributed ac- cording to the Bethe-Bloch curve for Xe [2] (see Fig. 1) to calculate the integrated probability for an ionization to happen at a certain distance using Eqs. | and 2. Figure 1: Relative energy loss in Xe [2]. Afterwards, the charge is distributed to different read out channels via the Pad-Response-Function (PRF) based on the Mathieson formula (see Fig. 2). With these steps we get multiple little ionizations at different positions along the track of the particle, together with their induced charges on each read out channel around its original position. In reality the ion drifts, which are collected by the front-end electronics, are formed into pulse shapes corresponding to the shaper function in Eq. 3 [1],](https://figures.academia-assets.com/61158213/figure_174.jpg)

![Figure 2: Measured charge distribution of a charged par- ticle passing through the detector and creating a signal on three adjacent readout channels [1]. Institut fiir Kernphysik, Frankfurt am Main, Germany](https://figures.academia-assets.com/61158213/figure_176.jpg)


![Even though a pre mass-production for the TOF FAIR phase 0 program of about 150 MRPC3a/b counter is fin- ished [3, 4, 5] the MRPC R&D especially for the inner TOF region is still ongoing. The development of the ce- ramic single cell MRPCs, foreseen for the Beam Fragmen- tation TO Counter (BFTC), is well progressed and test beam results are presented here [6]. The R&D for this type of counter will continue till 2021 and will be finalized based on test beam results at Rossendorf and mCBM. In the same time frame the PDR of the inner TOF wall is intended. The R&D regarding electrode materials and final design of this counter type (MRPC La-c) is ongoing aiming at tests of the latest prototype [7] in the mCBM beam time 2019. The counter R&D for the intermediate and outer region is mostly concentrated on the HV electrode and the FDR will be based on the mCBM beam time in 2020. Figure 1: mTOF wall at mCBM (left plot) and eTOF wheel at STAR (right plot).](https://figures.academia-assets.com/61158213/figure_180.jpg)
![wheel was build comprising 36 mod ules arranged in 12 sec- tors contributing to the STAR detector upgrade program. The 108 counters were read out by our current CBM stan- dard free streaming DAQ based on the AFCK and portions of data selected based on the STAR trigger token were send to the STAR event builder. That this approach was success- ful is demonstrated in Fig. 2 [9]. shows the PID capability of eTOF lower row show the phase space d n The upper row of plots while the plots of the istribution of the vari- ous hadrons. The data providing this plots were obtained during the beginning of the Beam Energy Scan campaign (BESID in 2019. Dedicated data analysis show a system time resolution in the order of 85 separation of kaons from pions up ps [10] which allows a to 1.8 GeV/c. In order to reach such PID quality a sophisticated calibration is re- quired [11]. Figure 2: Particle identification capability of eTOF demon- strated at STAR (upper plots) and phase space distributions for pions, kaons and protons (lower plots).](https://figures.academia-assets.com/61158213/figure_181.jpg)


![connection format to the NINO board format was made. Such an adapter is not resistant to noise interference and should not be used for accurate timing measurements. The results of the efficiency measurements and comparison to those obtained with PADI and MAXIM electronics are shown in Fig. 4. The results for NINO agree well with the MAXIM 3760 results. It should be noticed, that dur- ing this measurements due to high noise level the threshold value was set almost twice as high as that used in ALICE measurements. Furthermore, the width of the ToT spec- trum, which is shown in Fig. 5, exactly matched to the pulse length of 5 ns. In addition, the shape of ToT spectra agrees well with spectra of the ALICE TOF strip RPCs, obtained using the same electronics during ALICE R&D [4]. The time resolution, shown on Fig. 6 as function of the field strength in the gaps, amounts to 87 ps across the working plateau of the chamber. Figure 4: Registration efficiency versus field strength in a chamber for connecting discrete electronics based on a MAXIM 3760 amplifier (magenta curve), NINO elec- tronics (blue and red curves) and PADI electronics (black curve)](https://figures.academia-assets.com/61158213/figure_184.jpg)


![Figure 1: The two identical MGMSRPCs with 100 Ohm impedance mounted on the back pannel of the housing box. A MGMSRPC prototype with 32 readout channels was designed and built as basic cell for the inner zone of the CBM-TOF wall. The aim is to exploit efficiently both the active area of the detector as well as the 32 channels of a single front-end electronics baseboard for CBM-TOF. The inner architecture of the detector is the same as for RPC2015DS prototype [1], successfully tested in two in- beam test campaignes in both triggered [2] and free stream- ing mode operation [3]. The strip width of the readout elec- trode was obtained using the method described in [4]. A readout strip width of 1.27 mm corresponds to 100 © char- acteristic impedance of the differential transmission line for the present architecture. The obtained readout strip width is very close to the value of the strip width of RPC2015DS. However, in order to exploit efficiently the maximum avail- able size of the low resistivity glass, the strip width of the high voltage electrode increased from 5.6 mm to 7.37 mm. Consequently, the strip pitch, the same for both HV and readout electrodes, increased from 7.2 mm to 9.02 mm. The 60 mm strip length corresponds to the counters of the CBM-TOF inner zone with the highest granularity. After assembling, the two prototypes were preliminary tested in the detector laboratory. A pulser signal was split in two, one of the signals being used to trigger the oscilloscope, the other one being split again, one of these being inverted. The negative signal was injected in the anode and the positive one in the cathode readout strips, at one end, and recorded at the other end directly on the oscilloscope. The measured propagated signals through the transmission line did not re- veal any significant reflections. A cross talk test was also performed, injecting both polarity signals on the main strip (CH1 and CH2) and recording the signals of the first neigh- bour strip (CH3 and CH4), at the same side where the sig- nal was injected, the oposite side being closed and matched to 50 Ohm. As can be observed in the screen capture shown in Fig.2, the cross talk is negligible.](https://figures.academia-assets.com/61158213/figure_188.jpg)

![Figure 3: Snap-shot of real cosmic ray signals. We conditioned the detector applying gradually the high voltage up to the nominal value (2 x 5.5 kV). Real signals produced by cosmic rays were recorded. A snapshot of the signals from both cathode (CH1) and anode (CH2) readout strips recorded directly from the detector at one end of the strip and the output of the NINO FEE [5] i.e the LVDS signal (CH4) and the logic OR (CH3), recorded at the other end, are presented in Fig.3. As can be seen, one does not observe reflections on a time scale of 200 ns (20 ns/div).](https://figures.academia-assets.com/61158213/figure_190.jpg)


![mTOF is one of the sub-systems in the mCBM experi- ment [1], designed to measure the time of flight of charged particles. It features 5 modules (cf. Fig. 1 right) cov- ering an total area of 1.25 m x 1.5 m. During the com- missioning beam-time in December 2018 the mTOF wall was rearranged in order to allow quality assurance of the detectors. Therefore 2 stacks of 2 and 3 modules each (as shown in Fig. 1) were positioned at an angle of 25° with respect to the beam axis and 234 cm from the target. Each module contains five high rate MRPCs called MRPC3a [2], which contains low resistive glass sheets [3]. The high rate capability and good time resolution of these detectors are crucial for particle identification in high rate experiments. The first stack (module 4 and 5 in Fig. 1) of mTOF con- tains two modules, overlapping in the z-axis direction. It is located closer to the beam pipe and therefore exposed to higher particle fluxes. With this stack the aim is to test the rate capability of the MRPC3a counters. However, it is not trivial to get the efficiency of the counters reliably well with only one additional reference. Therefore the information of a TO (diamond counter) is needed. The situation is better for the second stack with three modules (module 1,2 and 3) overlapping in the z-axis direction. With tracks travers- ing all three modules, the efficiency of the MRPCs can be obtained more easily due to one more layer as reference detector. Figure 1: The mTOF experimental set-up and module structure. Left: The mTOF experimental set-up. It is lo- cated 234 cm away from the target, positioned under an angle of 25° with respect to primary beam. Right: One mTOF module. Each module contains five MRPC3as.](https://figures.academia-assets.com/61158213/figure_193.jpg)


![In 2018, we have managed to produce 73 high-rate MRPC3a counters with low-resistive glass electrodes at uctech in Beijing and tested them [1-2]. They were all de- ivered to Heidelberg University and assembled into mod- ules there. As part of the CBM FAIR phase 0 programs [3], 48 of these MRPC3a counters together with 60 MRPC3b from USTC are finally installed, commissioned and oper- ated as the endcap TOF system (eTOF) at the east pole tip of the STAR experiment. The eTOF project is also part of the BES-II detector upgrade at STAR. It will pro- vide particle identification in the extended pseudorapidity range provided by the iTPC upgrade to the main tracking chamber [4]. For STAR experiment, the eTOF upgrade will bring compelling new physics capabilities to the RHIC BES-II prgram. On the other hand, CBM also benefits from STAR-eTOF by providing a large-scale integration test of the CBM-TOF hardware and software system. Figure 1: The sketch of the only one eTOF sector installed in STAR Run18.](https://figures.academia-assets.com/61158213/figure_197.jpg)


![It is proposed to test FEE PSD board with MPPCs dedi- cated to collect light from mPSD module and to study read- out electronics during the mCBM beam test in March 2019. The ADC PANDA ECAL board [3] will be used for MP- PCs signal readout in the beam tests in standalone mode. In order to simulate light generation without mPSD mod- ule scintillation plates will be mounted directly on MPPC diodes on FEE card. Prepared FEE with slow control box is shown in Fig. 1. View of the ADC PANDA ECAL board is presented in Fig. 2. Figure 1: FEE board with scintillators glued to MPPCs and HV control box](https://figures.academia-assets.com/61158213/figure_212.jpg)


![Figure 1: Distribution of ionizing energy loss in transverse plane at 20 cm depth from the PSD module front. The calorimeter irradiation was simulated with the FLUKA code for 2 months of the CBM run with Au+Au collisions on a | % interaction Au target at beam energy of 10 AGeV at the beam rate of 10° ions/s. Fig. 1 shows that the absorbed dose in the PSD does not exceed 1 kGy. Dam- age by the ionizing dose which is the most crucial for the scintillator tiles was studied in details for calorimeters of LHCb experiment [2]. The relative light yield of the LHCb tiles degraded by 25 % after 2.5 kGy irradiation, and then slowly decreased further by 20 % after irradiation up to 14 kGy. Therefore, scintillators and WLS-fibers of PSD are not expected to degrade significantly. Moreover, the modu- lar structure and the longitudinal segmentation of PSD cou- pled with the regular calibration will ensure the stability of transverse and longitudinal uniformity of the light col- lection. Scintillator irradiation tests are being discussed to study their degradation in details.](https://figures.academia-assets.com/61158213/figure_222.jpg)
![Figure 2: Non-ionizing energy loss vs radius at transverse plane where MPPCs are located for different configurations of the beam hole. To avoid a high radiation load in the central modules, there is a beam hole in the center of PSD. Three different beam hole shapes were considered, namely round with a 3 cm radius, quadratic- and diamond-shaped of 20 x 20 cm? size. Fig. 2 illustrates the reduction of non-ionizing energy loss by factor of 2 at the distance of 10 cm from the beam axis for the enlarged beam hole. Diamond-shaped hole de- sign was chosen because it provided additional reduction to the ionizing dose compared to the quadratic-shaped de- sign [3]. Another safety measure in form of a dedicated neutron shielding based on 8 cm thick polyethylene blocks with 3 % of boron is introduced reducing the fluence up to factor of five.](https://figures.academia-assets.com/61158213/figure_223.jpg)
![wide range of 6 x 10/°-9 x 10!? n.,/cm?. After irradi- ation with 2 x 10" n.4/cm? MPPC dark current increased by 3 orders of magnitude and reached 10 A [4]. This re- sulted in the increase of noise by 1 order of magnitude and consequent drop of signal to noise ratio down to ~ 50. Figure 3: Single module proton energy resolution vs beam energies for different neutron fluences acquired by MPPCs (top) and vs fluence for different beam energies (bottom).](https://figures.academia-assets.com/61158213/figure_224.jpg)


![The magnet field saturation inside the CBM magnet is shown in Fig.2. Maximal field saturation is at the poles. Figure 3: Field distribution inside the CBM dipole magnet obtained by VIEM [4].](https://figures.academia-assets.com/61158213/figure_239.jpg)

![Figure 4: The comparison of the results obtained by VIEM [4] and with TOSCA [3] for the vertical component of the magnetic field.](https://figures.academia-assets.com/61158213/figure_241.jpg)

![The CBM superconducting dipole magnet has to provide the bending power of ~1 T-m and quite low stray magnetic field in the region of RICH [1]. The magnetic field in the vicinity of the RICH photodetector has been calculated for BINP design of the CBM magnet. The 3D- model of CBM dipole magnet with RICH photodetector without z- sym- metry for the TOSCA [2] simulation is presented in Fig: 1.](https://figures.academia-assets.com/61158213/figure_243.jpg)


![BINP design of the CBM superconducting dipole mag- net with the enlarged vertical aperture up to 1440 mm is shown in Fig.1. It has few differences from the initial one [1], namely, the cylindrical poles, 4 flat vertical beams and 6 narrow horizontal beams. The materials of the poles and yoke are the ARMCO and the SA1010 steel, respectively. Magnetic and stress analysis for BINP design was made with the ANSYS [2] and TOSCA [3].](https://figures.academia-assets.com/61158213/figure_249.jpg)


![The GBT-based readout requires support for CROB boards capable to connect multiple FEBs, with different configurations of SMX2 chips. The structure of the DPB firmware was reorganized as shown in Fig. 1. The main Figure 1: Block diagram of the CROB-oriented DPB firmware (modified figure from [1]).](https://figures.academia-assets.com/61158213/figure_279.jpg)


![The radial distribution of point density & hit density for 3"¢ & 4'” station have been shown in Fig. 4 and Fig. 5 respectively. These are somewhat lower compared to pre- vious GEM geometry and digitization [2].](https://figures.academia-assets.com/61158213/figure_318.jpg)


![All simulations have been performed in CbmRoot us- ing the dielectron analysis package. For both setups a tar- get thickness of 25 jzm has been chosen. The magnetic field has been scaled to 50% for Au+Au collisions and to 60% for Ag+Ag collisions. All CBM detectors were imple- mented using the standard geometries as of Summer 2018 except the MVD detector. Simulations were performed us- ing UrQMD as event generator. In each event a signal di- electron pair generated by PLUTO was embedded. As sig- nal di-electrons either w, ¢ and in-medium p [4] decays into e+ e~, w-Dalitz decays, or QGP radiation was imple- mented. Signals were scaled later according to their esti- mated multiplicity and branching fraction [5]. It is impor- tant to notice, that scaling factors were changed from the previously used estimates from HSD to values using a ther- mal model [6]. This reduced the w multiplicity by a factor 8 but enlarged the @ multiplicity by a factor 3. Thus com- parisons of S/B ratios from these simulations to previous simulations have to account for this factor. Figure 1: Invariant mass spectra for 5M central Au+Au col- lisions (left) at 8 AGeV and 10M minbias Ag+Ag collisions (right) at 4.5 AGeV beam energy excluding any pt-cut.](https://figures.academia-assets.com/61158213/figure_330.jpg)


![motivated to investigate 1 A GeV intervals for the excita- tion function and even 0.5 A GeV, such that we can see the formation or ”kind” of the plateau. We can also ob- serve a peak at 18 A GeV (Fig. 3, left). These plateaus and the peak suggest a possible mixed phase. The plateau forms that we obtained seems to be in agreement with the results from [1]. Here, the results suggest the formation of the mixed phase based on the calculations of pion/baryon, and entropy/baryon ratios in the energy range 6.9 - 11.6 A GeV, and these are compared with the AGS (Au-Au) and SPS (Pb-Pb) data for regions with anomalous thermody- namic properties.](https://figures.academia-assets.com/61158213/figure_336.jpg)


AI