 Paul Kah
580 California St., Suite 400
San Francisco, CA, 94104
This paper presents the results of experimental studies to control the base pressure from a convergent nozzle to ascertain the effect of level of expansion on a suddenly expanded sonic flow. An active control in the form of four micro jets of 1 mm orifice diameter located at 90 0 intervals along a pitch circle diameter of 1.3 times the nozzle exit diameter in the base region was employed to control the base pressure. The area ratio (ratio of area of suddenly expanded duct to nozzle exit area) studied is 2.4. Experiments were conducted for nozzle pressure ratio (NPR) from 1.5 to 3, in steps of 0.5. The length-to-diameter (L/D) ratio of the enlarged duct was varied from 10 to 1, and tests were conducted for L /D 10, 8, 6, 5, 4, 3, 2 and 1. It is evident from the results that the flow field downstream of the reattachment-redevelopment is very complex. It is found that, unlike in the case passive controls, the favourable pressure gradient does not ensure augmentation of the control effectiveness for active control in the form of micro jets. To study the influence of micro jets on the quality of flow in the enlarged duct wall pressure was measured and it is found that the micro jets do not disturb the flow field in the duct.


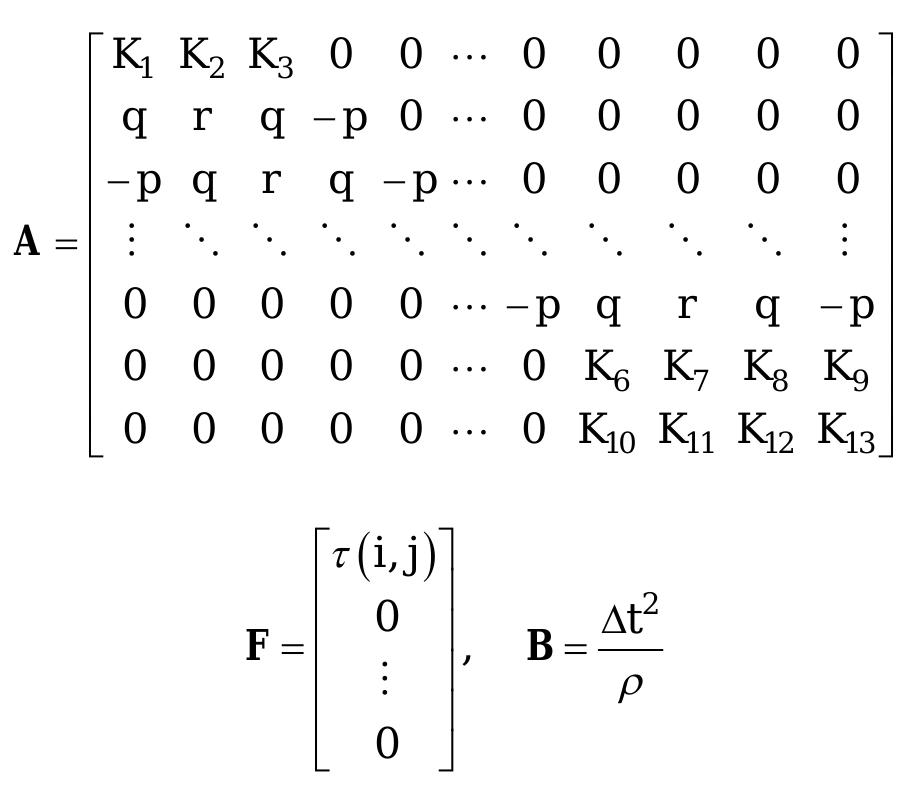
![The fourth-order partial differential equation (PDE) in Eq. (2) represents the dynamic equation describing the motion of the flexible manipulator. Note that the model in Eq. (2) does not incorporate damping. The well-known goveming equation of the manipulator with the associated boundary and initial conditions can thus be obtained as [13], [14]:](https://figures.academia-assets.com/38009008/figure_013.jpg)


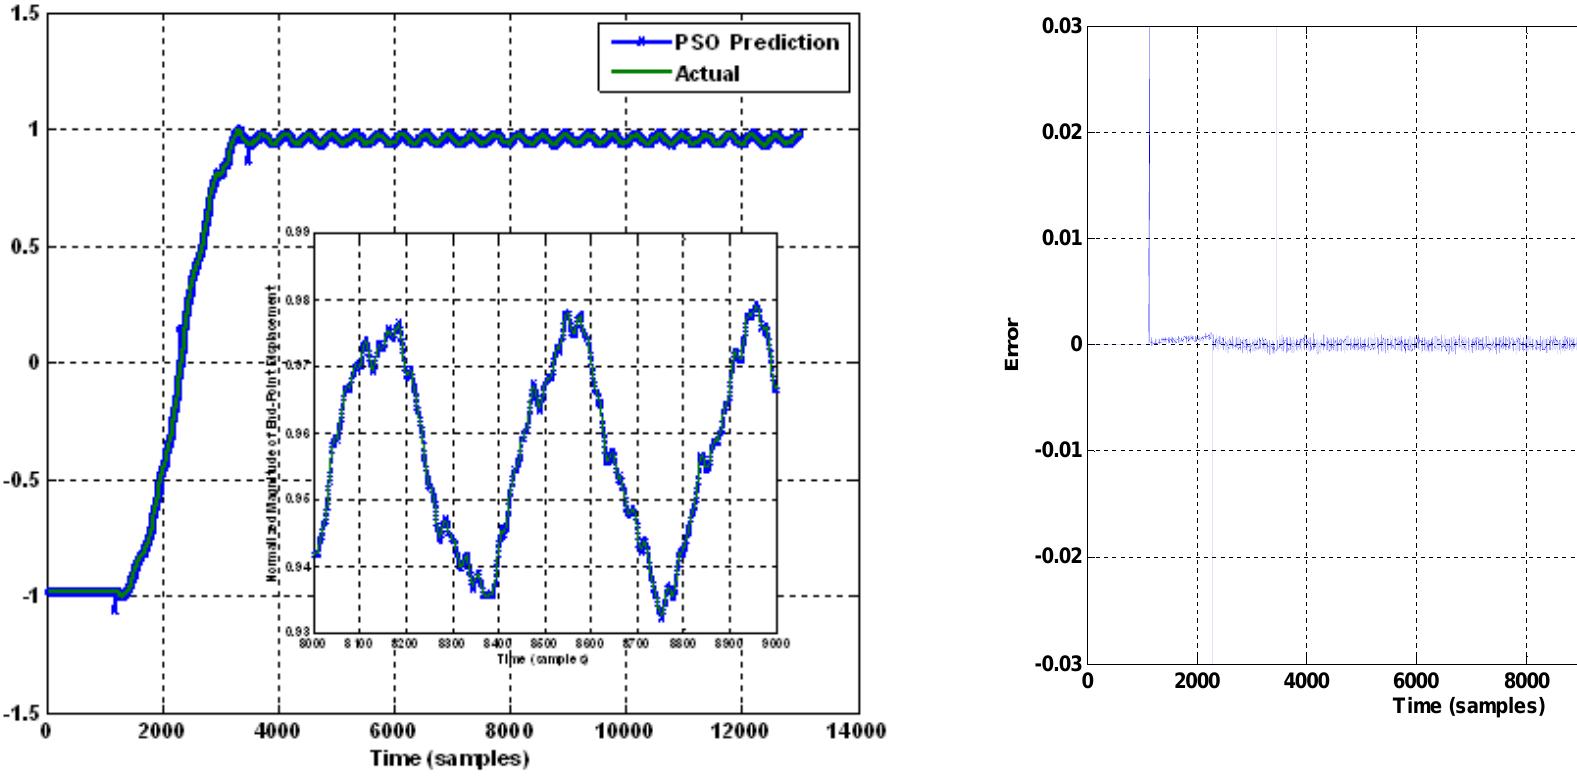
![The optimization of PSO is in a guided and intelligent manner and can perform complex tasks as a group [18]. Stages of PSO can be comprised as follows: Xq(t) and vq(t) represent position and velocity](https://figures.academia-assets.com/38009008/figure_022.jpg)


![RSM is a method for illustrating the correlation between multiple variables as an input and output. For the specific objective functions, like SEA and PL in this study, they are assumed in terms of basis function [45], [46], [47]:](https://figures.academia-assets.com/38009008/figure_041.jpg)
![Any further improvements on SEA must sacrifice the PL and vice versa. In fact, any points in Pareto frontier can be the optimal case which is up to the designer depending on its significant level. To generate the Pareto frontier, the multi-objective optimization using Genetic [50] Algorithm of MATLAB language programming was used.](https://figures.academia-assets.com/38009008/figure_042.jpg)


![Fig. 6. An iteration of the NSGA-II procedure TII.3. Multi-Objective Differential Evolution (MODE) MODE [2] can be categorized into a class of floating- point encoded evolutionary algorithms. The theoretical framework of MODE is very simple and MODE is computationally inexpensive in terms of memory requirements and CPU times. Thus, nowadays MODE has gained much attention and wide application in a variety of fields. MODE’s advantages are: simple structure, ease of use, speed and robust.](https://figures.academia-assets.com/38009008/figure_051.jpg)


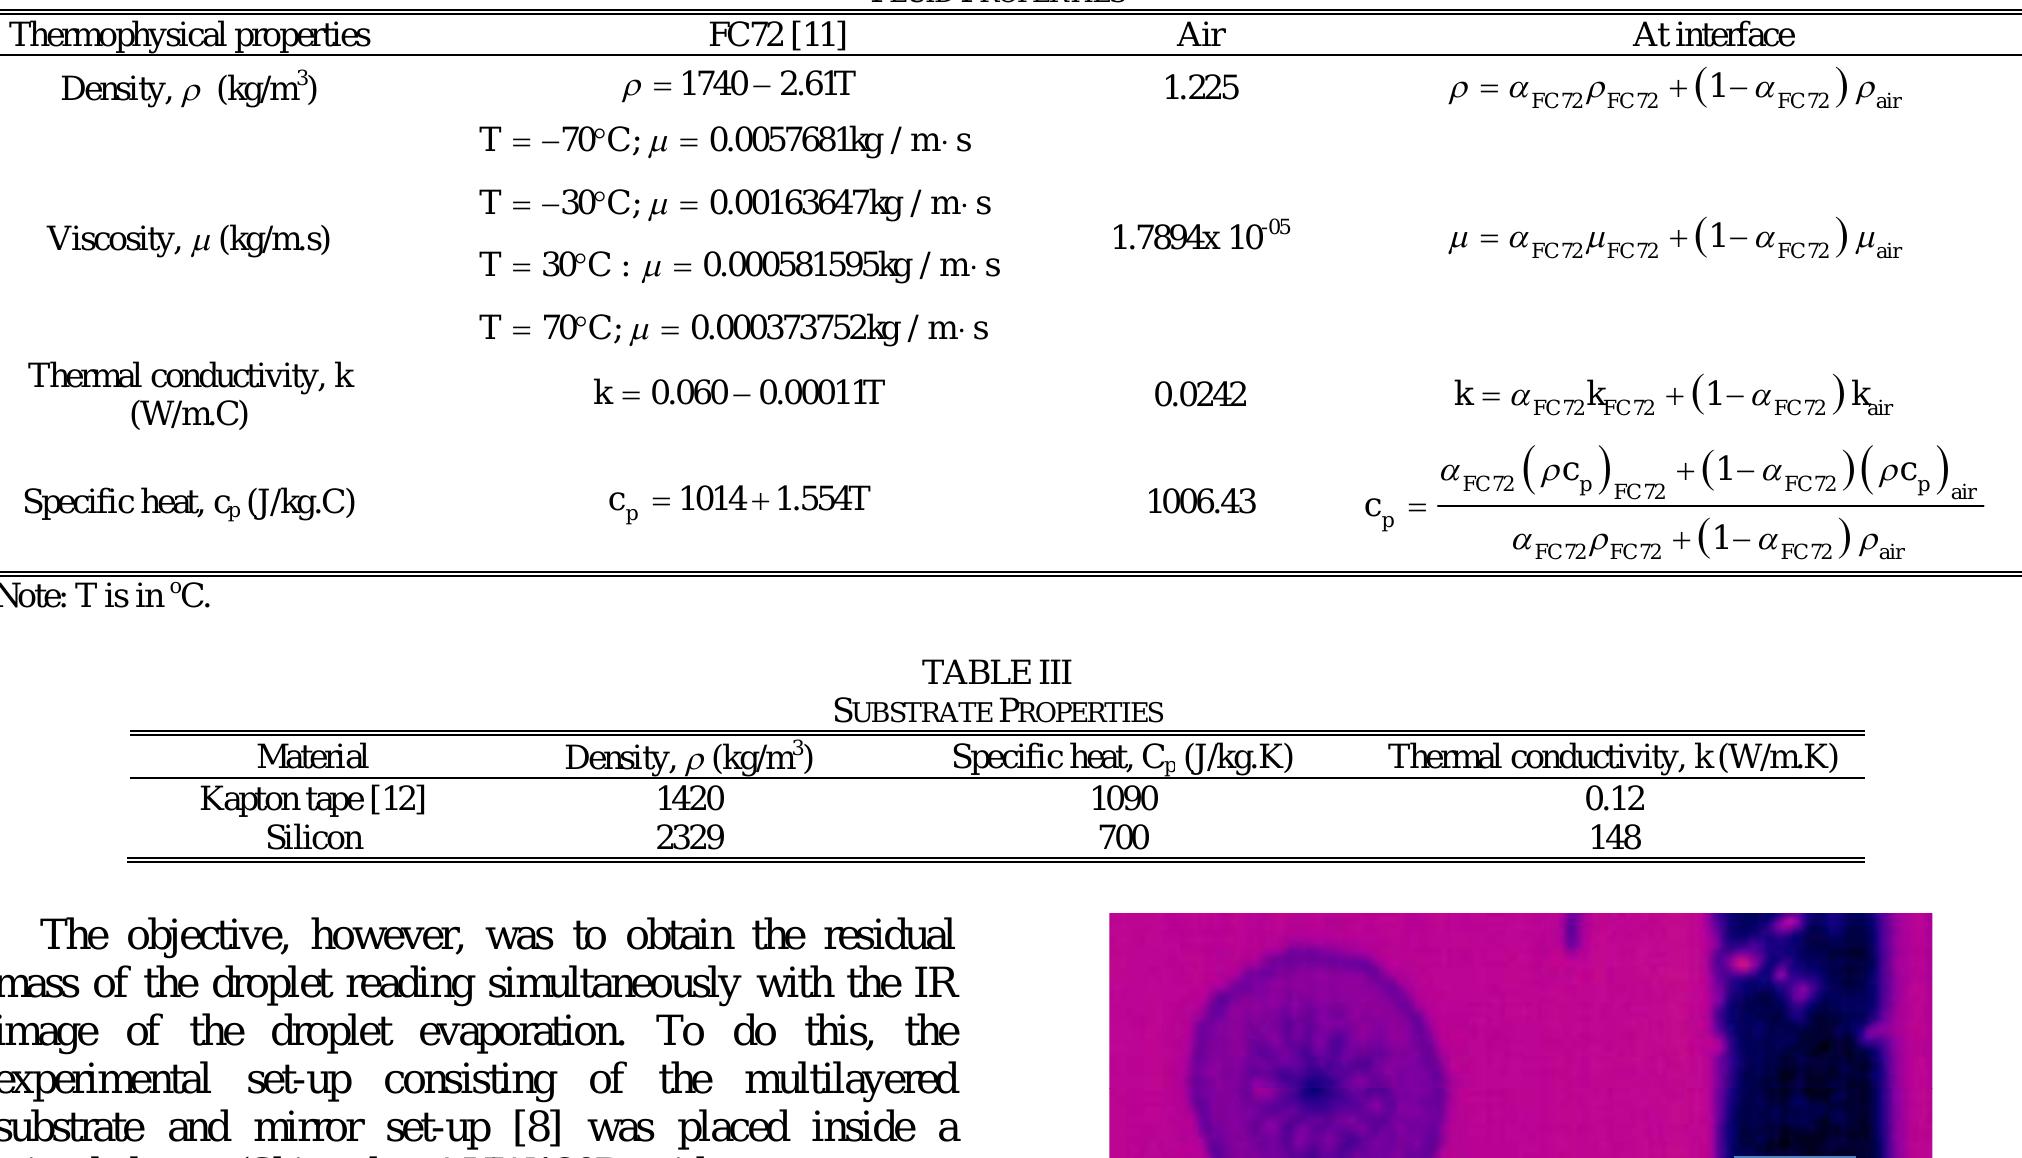
![A constant static contact angle, 6,=8° was specified [8]. The difference between the initial radius and height for experiment and the simulation is due to the number and size of the mesh used in the droplet region of the computational domain. The experiment assumed that the droplet temperature was the same as that of the ambient [8]. However, based on the infra red (IR) images of the experiment, the droplet temperature just before the droplet touches the surface of the substrate has about a 3°K temperature difference with the substrate. Hence, at t=0, the simulation assumes the droplet to be 3°K higher than the substrate and ambient.](https://figures.academia-assets.com/38009008/table_022.jpg)


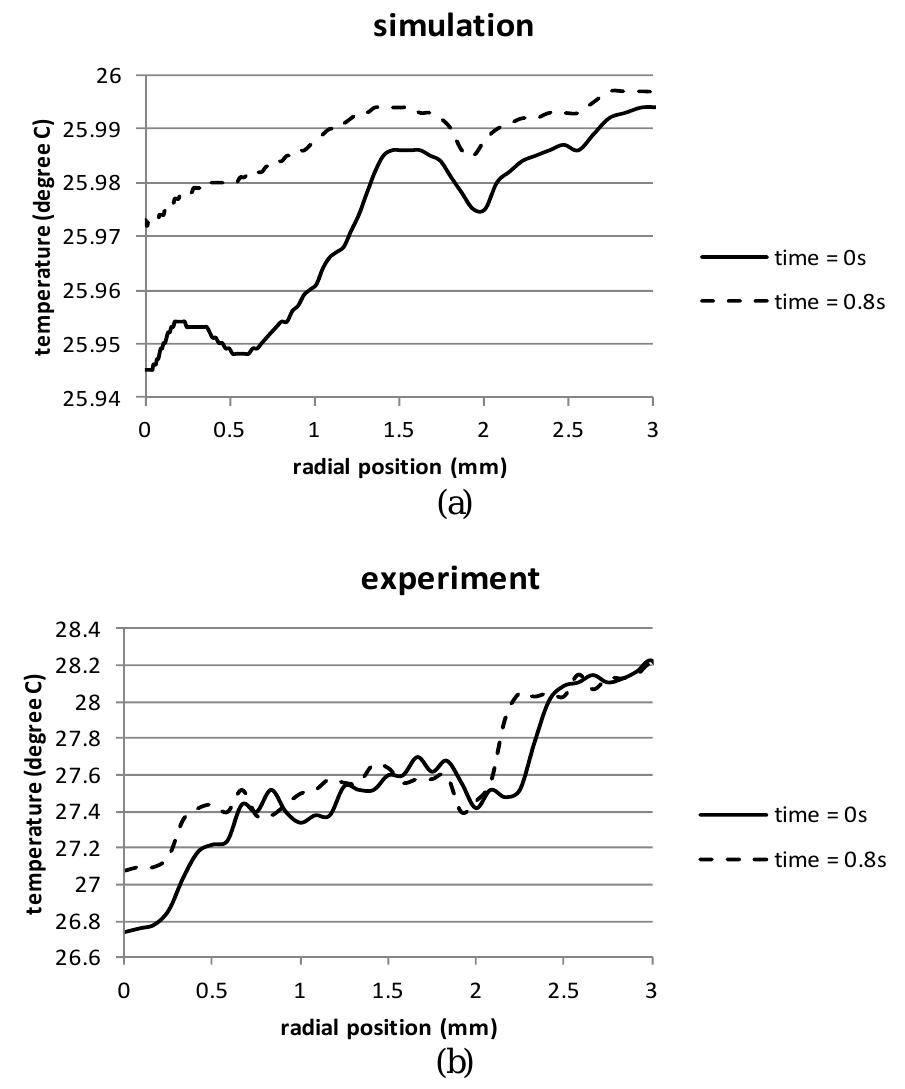

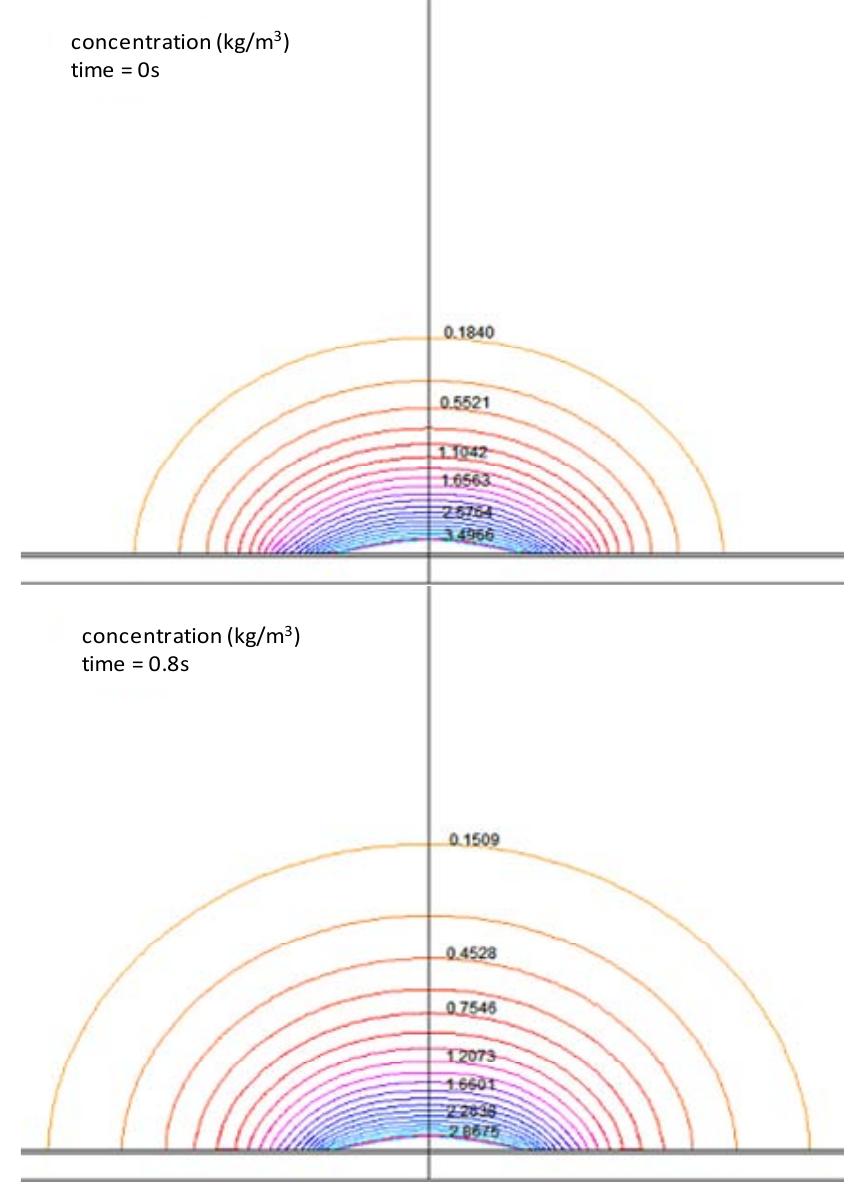

![Nevertheless, we can still observe flow pattems inside the droplet through the side view of the droplet. A few 2-D simulations have been shown to be able to show the occurrence of hydrothermal waves inside the droplet [18], [19]. This particular simulation also observed some wave pattems believed to be hydrothermal waves inside the droplet. These waves seem to dictate the movement of the fluid inside the droplet. In Fig. 11, the flow inside the droplet seems to start at the top centre of the droplet and flows down the centre reaching the bottom of the droplet.](https://figures.academia-assets.com/38009008/figure_068.jpg)


![The old classic engines yield can be improved by using a two stroke engine or a four stroke in V engine. — Consider below this value of thermal efficiency which may be obtained for thermal engines intemal combustion [24], but it's difficult, and especially to keep those with extemal combustion, will be determined the values of final yield of an intemal combustion engine for three individual cases: a two-stroke engine (Lenoir) [27], a four-stroke engine (Otto or diesel) normally [28]-[29], and one four-stroke in V (see the relationship (8)):](https://figures.academia-assets.com/38009008/figure_075.jpg)
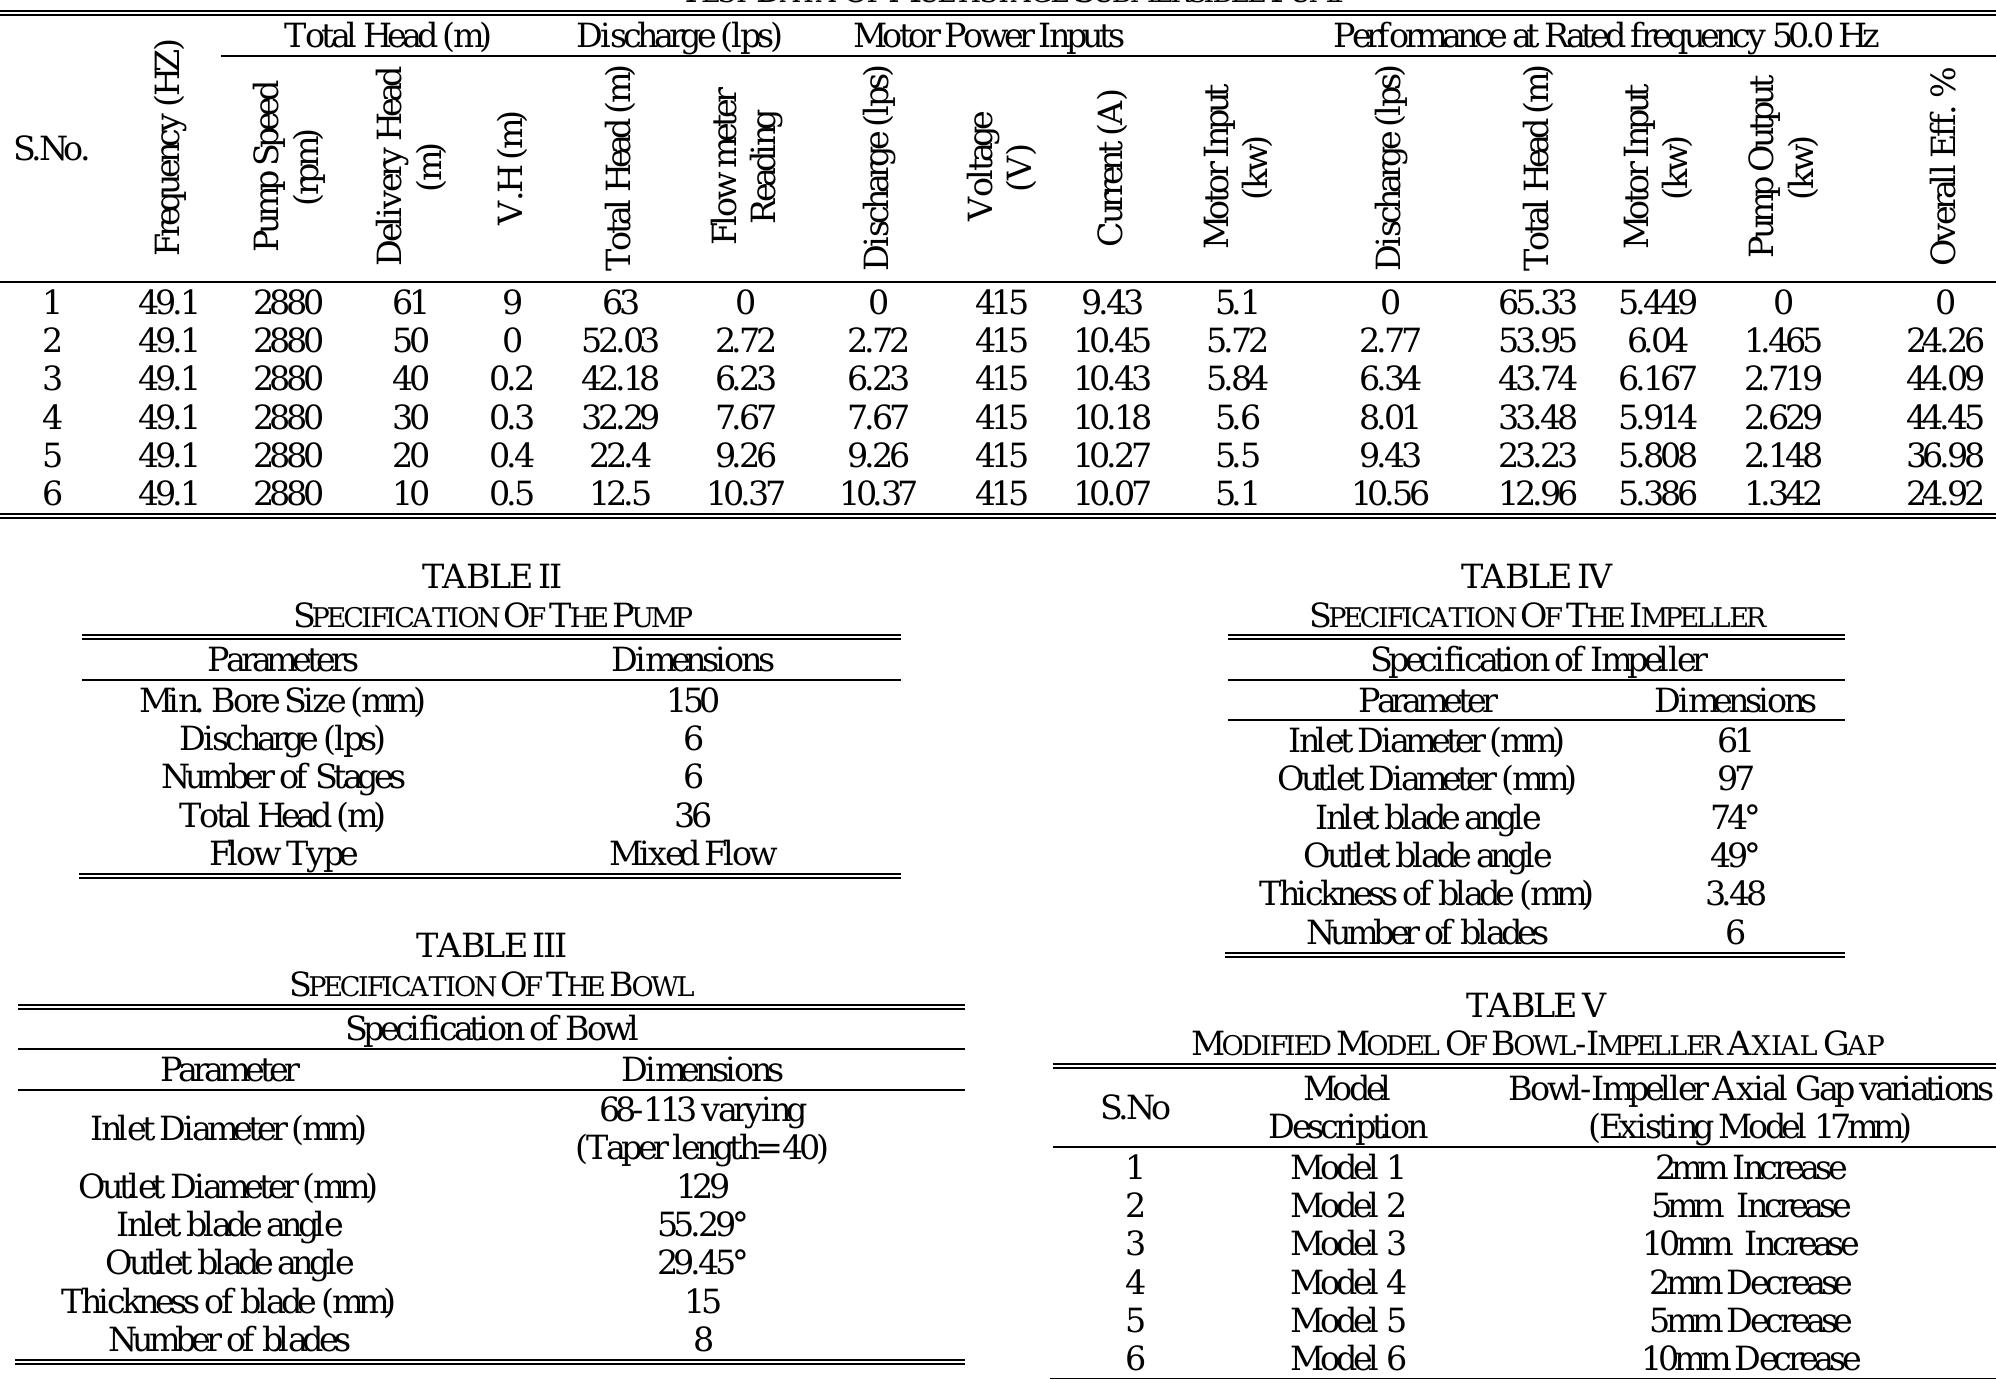


![It has been shown in the previous paper J. Manikandan et al [10] that the best practices of Computational Fluid Dynamics (CFD) for the problem wes found that k-e Realizable Model is predicted when comparing to the other turbulence models. K-e model solves two transport equations for accounting 1, into the conservation of momentum equation: where k is the turbulent kinetic energy, « is the dissipation rate, 1 is the laminar viscosity, py, is the turbulent viscosity, G, is the generation of turbulent kinetic energy due to the mean viscosity gradients, ox, and o,, are the turbulent prandtl numbers and C;, =1.44, Cy, =1.92 and C,, =0.09 are the constants of the model.](https://figures.academia-assets.com/38009008/figure_079.jpg)


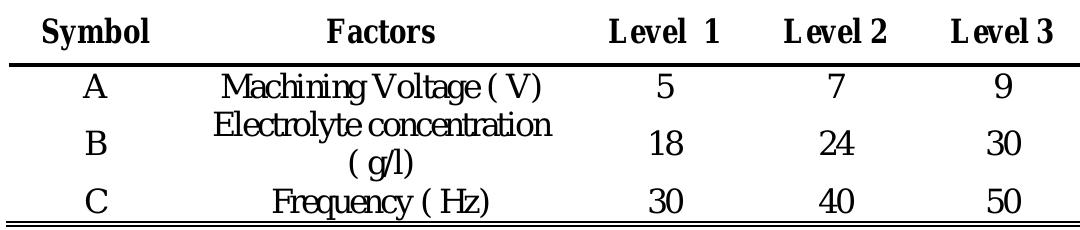


![The electrolyte supply system consists of filter and pump arrangement. A pulsed power supply of 20 V and 30 A with capability for varying voltage, current, and pulse width was used [15]. The electrolyte of varying concentrations used in this study was sodium nitrate (NANos) and Al-10%wt SiC, - of thickness of 0.4 mm as work piece. Based on the literate review and preliminary experiments conducted, the initial process parameters and their corresponding levels are chosen.](https://figures.academia-assets.com/38009008/figure_091.jpg)


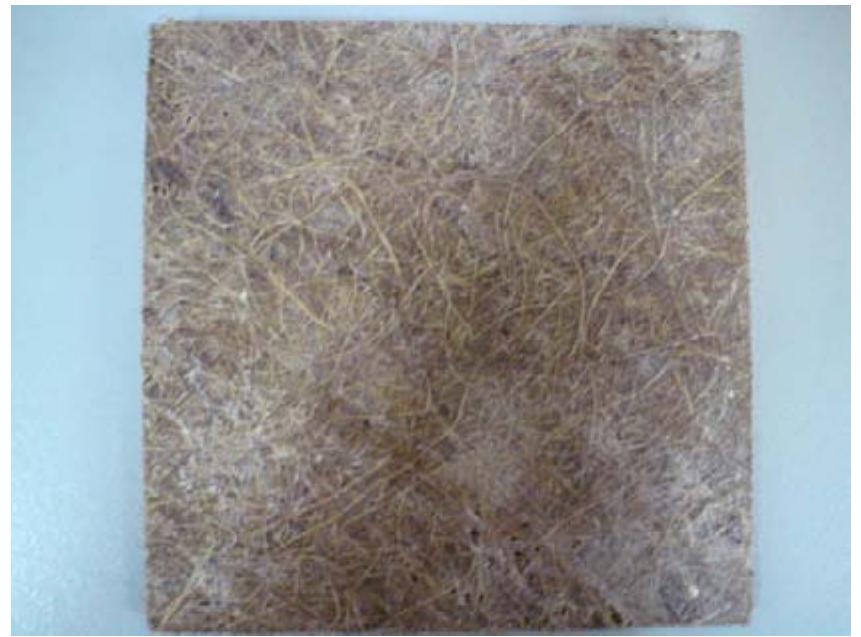


![The results than compared to the flexural strength for pressed mat coir fiber-polyester composite under two different fabrication compression pressures which are 2.6 MPa and 5.2 MPa that was done by Monteiro et. al [9] as shown in Fig. 5. This suggests the strength tends to decrease with the amount of fiber and reveals that the randomly oriented coir fibers are not reinforcing neither epoxy matrix nor polyester matrix at all. Several measurement points (25% and 35% wt fibre) had not been included in Monteiro work. Besides that, the different in pressures did not be a major influence to the value of flexural strength compared to the difference type of matrix that has been used. Fig. 5. Variation of the flexural strength with the mass fraction of coir fibre for different compression fabrication pressures](https://figures.academia-assets.com/38009008/figure_106.jpg)


![Copyright © 2014 Praise Worthy Prize S.r.]. - All rights reserved](https://figures.academia-assets.com/38009008/figure_162.jpg)


![Fig. 2. Wear test ng Taguchi method has been used to study the effect of three wear parameters (Temperature, load, sliding velocity) on wear of AISI 202. To find the optimal combinations the following step by step procedure is followed for the DOE [12]:](https://figures.academia-assets.com/38009008/figure_172.jpg)


![Fig. 3. Methodology adopted to compare and optimize different multi-strand tundishes This would cause change in dimensions or transient parameters for all the processes or units before the tundish. This would cause change in dimensions or transient parameters for all the processes or units before the tundish. The dimensions of all the tundishes were taken to be the same and thus the flow rate of liquid steel was maintained by controlling velocities of liquid steel at the inlet gate and outlet strand gates. The values of the properties of liquid steel used were [18]-[22]: specific density = 7010 kg/m’, specific heat = 821 J/kgK, thermal conductivity = 30.5 W/mK and viscosity = 0.007 kg/ms. An accurate representation of fluid turbulence is a challenging task in the simulation of the flow in a steel tundish. We have used the standard k-e model [23], a two equation turbulence model. In the ke model, two transport equations, one for the turbulent kinetic energy (kK) and other for its dissipation rate (c) are used to calculate the eddy viscosity. It is a widely used turbulence model for industrial applications.](https://figures.academia-assets.com/38009008/figure_196.jpg)
![The values of the constants used in the ke model are C; = 1.44, C, = 1.92, o, = 1.0, o. =1.3 and C, = 0.09 [23], [24]. The mentioned Eqs. (1) to (5) wer solved numerically using the finite volume method to obtain an Eulerian flow field. The boundary conditions described in Section III.2 were applied to obtain the flow field.](https://figures.academia-assets.com/38009008/figure_197.jpg)
![Fig. 4. A comparison of the present mixing time characteristics for the Far outlet (a), middle outlet (b) and near outlet (c) with those reported by Merder et al. [18]](https://figures.academia-assets.com/38009008/figure_198.jpg)
![Fig. 5. A comparison of the present inclusion removal with results reported by Mikki and Thomas [1]](https://figures.academia-assets.com/38009008/figure_199.jpg)


![Fig. 1. Maximum weld travel velocity, heat source spot size, and interaction time with respect to the intensity of the heat source [3] Automatic aluminum welding can be achieved by using different processes like tungsten inert gas (TIG) welding, metal inert gas (MIG) welding, and other common welding technologies. Welding processes moving at a high speed with a too short dwell time (less than 0.3 s), which varies with the intensity of the heat source, must be automated and cannot be controlled manually as shown in Fig. 1.](https://figures.academia-assets.com/38009008/figure_203.jpg)
![Fig. 2. Comparison of single wire and tandem wire MIG welding of an aluminum fuel tank [18] Aluminum is one of the most difficult materials to melt with laser [33] due to the poor coupling (absorption of the beam energy by the metal being welded), high thermal conductivity, high reflectivity, and low boiling point [4]. As the wavelength of the laser increases, the coupling becomes poorer [34]. It was reported that a Nd:YAG (solid state laser) with a characteristic wavelength of 1.06 jim provides better coupling with aluminum than a CQO, laser with a characteristic wavelength of 10.6 jim [35].](https://figures.academia-assets.com/38009008/figure_204.jpg)
![Figs. 3. (a). Schematic diagram of plasma-MIG weld system [31], [32], (b) General layout of a robotic plasma-MIG welds system [31]](https://figures.academia-assets.com/38009008/figure_205.jpg)

![Figs. 4 (a) Schema of laser-MIG hybrid system [42] (b) KUKA KS Hybridtec (Laser-MI system) [43](https://figures.academia-assets.com/38009008/figure_206.jpg)


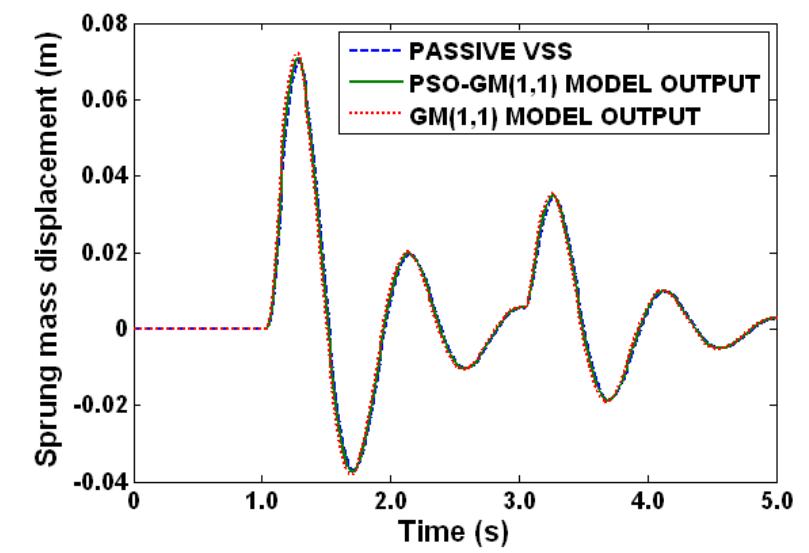
![The term a is the weight [17]. In traditional GM(1,1) model the value of o in B matrix or data matrix is chosen as 0.5 [16] and:](https://figures.academia-assets.com/38009008/figure_209.jpg)


![Fig. 4. Flowchart of PSO algorithm The GFLC strategy only treats next position output error of the sprung mass displacement and the rate of change of the sprung mass displacement and the rate of change of error. This cannot effectively overcome the dynamic effect of the tyre deflection in the suspension system. The dynamic effect causes a bouncing phenomenon in tyre that not only decreases road-holding of the vehicle but also increases the acceleration of the vehicle body [20]. The tyre deflection always affects the road holding of the vehicle, especially when the tyre is rotating. Therefore ride comfort as well as road-holding ability of the vehicle is affected. Hence two FLCs (FLC1 and FLC2) are designed to improve both road-holding ability and the ride comfort of the vehicle simultaneously. This Modified FLC strategy involving two GFLCs is known as Modified GFLC.](https://figures.academia-assets.com/38009008/figure_212.jpg)


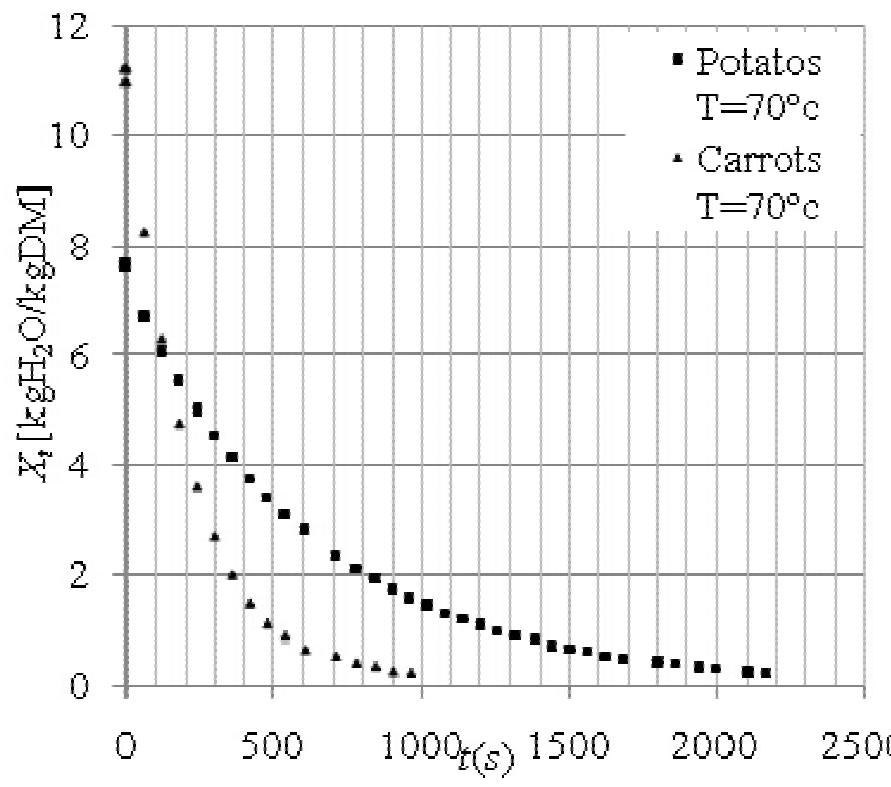
![Fig. 3(a). Evolution of water content with time After 30 minutes of drying, for example, X =2 [kg water/ kg DM] at 50°c and X =1 [kg water’ kg DM] at 70°c. Comparing changes in water content over time X, for temperature drying of 70°C and 50°C, Figure 3(a) shows a decrease in water content over time and when the drying is done for 50°C, it is slower than 70°C.](https://figures.academia-assets.com/38009008/figure_223.jpg)


![This is because part of the SiC particles are entered in between the pin and the MMC disc possibly leading to three-body abrasion (tribolayer), resulting in surface roughness between contact surfaces and increase coefficient of friction. These results are in agreement with those reported by Adem Onat [5] and R. N. Rao et al [3]. Fig. 11. Variation of friction coefficient with applied load sliding against MMC disc](https://figures.academia-assets.com/38009008/figure_265.jpg)
![During sliding, frictional force acts between the counter surfaces, which cause frictional heating of the counter surfaces. Lower the frictional heating parameter [10], less heat only dissipated to the surroundings. ‘The average value of frictional heating parameter for Al7075- 25wt% SiC composite disc was found to be 9.98x10° C/J, where as it was 14.55x10° ‘CfJ for cast iron disc, therefore the MMC disc mins cooler than C.1I disc. Fig. 12. Increase in contact temperature as a function of load of C.I. disc sliding against friction material](https://figures.academia-assets.com/38009008/figure_266.jpg)


![Fig. 3. Predicted and measured resultant force for one insert cutting, C10 (RPM 1000, Depth of cut of 40 and Chipload of 8) The effect of the type of training algorithm used was investigated next Levenberg-Marquardt (trainlm), Resilient Back Propagation (trainrp) and Scaled Conjugate Back Propagation (trainog) algorithms were To study the effect of varying the number of hidden layers on the accuracy of the ANN prediction, FFBP networks with one and two hidden layes wee investigated. Since the predictions obtained from varying the training function (Table I) showed that trainlm gave the best results, it was used here for all the cases considered. The tansig transfer function was selected as the use of this function allows a nonlinear relationship between the input and the output, moreover, this function is self limiting and hence the output cannot grow infinitely large or small [22]. Table II shows a comparison of the results obtained using one and two hidden layers for cutting condition C8. For the case shown in Table II, the predictions show that a FFBP with two hidden layers result in the lowest error. Additional runs are needed to generalize these findings for other cutting conditions and other types of ANN.](https://figures.academia-assets.com/38009008/figure_272.jpg)


![The main objective for the first stage control is to control the secondary superheater outlet steam temperature at 452 Deg C at rated load. The second stage control type is feedforward cascade PID control and the main objective is to control the boiler outlet steam temperature at 541 Deg C at rated load. The power plant apply 2 stages main steam temperature control circuit as shown in Fig. 2 [1]. The first stage control is feedforward PID control.](https://figures.academia-assets.com/38009008/table_070.jpg)
![Fig. 1. The coal fired power plant steam circuit with important steam temperature setpoint [1]](https://figures.academia-assets.com/38009008/figure_281.jpg)
![Fig. 2. Current main steam temperature control circuit [1] Around the same time, Hebb's introduced Hebb's leaming rule or Hebb's synapse [7] which discussed about hypotheses of neural substrate of leaming and memory. However Rosenblatt's work of Perceptron really increase the understanding about artifidal newel network. Rosenblatt's demonstrated his algorithm capability of pattem recognition that could leam and its ability to classify linearly separable pattem classes [8]- [11]. Neural network also used for solving non-linear problem by integrating with other type of non-linear solving method [12]. There are also modeling of the complete power plant utilizing neural network [13].](https://figures.academia-assets.com/38009008/figure_282.jpg)


![Then, in the second stage a rule base is constructed with the predefined fuzzy mules, which are based on the knowledge about the system characteristics coming from the experts. Since the outputs of fuzzy controllers cannot be used directly, they are converted, in the last stage, to crisp values using a suitable defuzzification method (Fig. 3, [6]). Forward and backward controllers use the whole range of the device universe. Therefore, the maximal values of the emor and its changing range should be equal to the limit of the universe. The universe is in the range of -90° to +90°.](https://figures.academia-assets.com/38009008/figure_286.jpg)
![Figs. 4. Membership Functions of the Fuzzy Logic Controller: (a) Membership functions when the robot moves to take a piece froma flat surface, (b) Membership functions when the robot rises up on a 90°ramp, (c) Membership Functions of the speed (PWM) Generally, a 8&bit microcontroller uses triangular shapes and singletons represented in a point-slope format. Singletons require one byte for descriptions while triangular shapes need three bytes: two points located on the variable axis and one slope or grade value. Figs. 4 show the different membership functions used in this work to fuzzifyy the inputs [11].](https://figures.academia-assets.com/38009008/figure_287.jpg)


![Fig. 5. Fuzzy PI output surface The Fuzzy PI surface has been plotted using MATLAB in Fig. 5. The PWM output is based on the PI controller equation as Pwm =P +1 [16].](https://figures.academia-assets.com/38009008/figure_288.jpg)


![Fig. 1. Touch sensing representation [15] va Sa 6 ESS Skee RRR an RS RE Ip en GR IRE tet The robot stores the position data and then automatically makes adjustments to the weld path prior to the arc start. Touch sensing can make adjustments in one, two, or three dimensions [15]. The robotic process usually starts with the robot in a search start position; a safe voltage is added to either the wire or the gas nozzle (or a probe attached somewhere near the welding torch) and the robot starts moving towards the expected joint position. International Review of Mechanical Engineering, Vol. 8, N. 1](https://figures.academia-assets.com/38009008/figure_298.jpg)
![Figs. 2. (a) GITAW robot welding system (b) seam gap viewed by CCD [20] ‘The image is then processed to measure.](https://figures.academia-assets.com/38009008/figure_299.jpg)
![Fig. 3. Three directional image acquired inGTAW duminum wadding [14] Tracking and control of the wire extension, thus controlling the wire-feed rate, has been successfully applied to meet the control requirements of wire extension stability [25]. Coupling the two prior sensing cameras permits control of the wire extension and weld pool width at the same time [26]. No application for real-time seam tracking using passive vision has been reported for aluminum GMAW.](https://figures.academia-assets.com/38009008/figure_300.jpg)


![The production of biogas depends on different parameters, such as the waste composition, the water content, temperature and density of the medium to be taken into account in the kinetic models hiogas production. The production of biogas changes depending of degradable components waste and quantity. The production of biogas is defined by exponential law proposed by Halvadakis. This law is malfunctioning for the first years degradation of a young waste, but applies verv well to the anaerobic phase (Finidikakis and al) [9]: i ame? I aa Therefore the Eq. (2) and Darcy's law leads to the following equations: where n is the porosity of the medium, and ) , pg the density of liquid and gas phases. V, the rate of filtration of P the phase defined by Darcy's law and ag the term the production of biogas. This latter term is defined from the biological model of degradation and biogas production.](https://figures.academia-assets.com/38009008/figure_304.jpg)


![Fig. 1. US electrical energy generation [11] Pollutant emissions are reduced because flame temperatures are typically low, reducing thermal NO, formation. Table I compares the pollutants from natural gas, oil and coal. The use of natural gas will reduce the impact of fossil fuel combustion on climate change. In order to further reduce NO, and other harmful pollutants, lean mixtures will reduce the combustion temperature and decrease the formation of NO,.](https://figures.academia-assets.com/38009008/figure_327.jpg)
![Figs. 2. Global greenhouse gas emissions a) by type of gases b) by type of sources [14] Fig. 3 plots the formation of NO,. In order to achieve low NO, emissions, the flame temperature of the combustion must be below 1425°C (1698 K). Above that temperature, the NO,, formation will be very high.](https://figures.academia-assets.com/38009008/figure_328.jpg)
![Fig. 3. The rate of NO, formation for flame temperature [13]](https://figures.academia-assets.com/38009008/figure_329.jpg)
![Fig. 4. Schematic regime diagram for methane-air JHC flames [39]-[40] The oxygen dilution plays the most important role in achieving MILD combustion as shown in a step by step illustration of oxygen dilution in Figs. 5. Recent applications of MILD combustion have been in research and development of gas turbines [24]-[25], [41] and gasification systems [42]-[43]. This combustion mode can be very interesting in gas turbine applications due to low maximum temperatures (very close to the ones at the inlet of a gas turbine), noiseless characteristics, good flame stability and effectiveness in reducing pollution emissions.](https://figures.academia-assets.com/38009008/figure_330.jpg)
![Fig. 6. Carbon dioxide closed cycle for biogas [48] Table III shows a comparison of energy balance for natural gas with 97% methane. The summary was made for the fumace which operates in the flameless mode and conventional mode with natural gas. The supply of thermal energy was constant at about 21 kW for both conditions.](https://figures.academia-assets.com/38009008/figure_331.jpg)
![Figs. 5. Step by step of MILD combustion (a) combustion started, (b) to (d) progressively more dilute oxygen (e) fully MILD combustion [45].](https://figures.academia-assets.com/38009008/figure_332.jpg)

![Fig. 8. Efficiency of the heating system with EGR [51]](https://figures.academia-assets.com/38009008/figure_333.jpg)
![The difference for Fig. 8 is the fumace running with the regenerator (EGR) and from 654 BTU of heat in the flue gas; only 133 BTU is lost through flue gas to the atmosphere. Some of the 521 BTU of heat is retumed back to the system via the regenerator. The efficiency is 37.4% for the system without EGR and 72.4% for the system with EGR and the system with EGR is 35% higher. Fig. 7. Efficiency of the heating system without EGR [51]](https://figures.academia-assets.com/38009008/figure_334.jpg)
![Fig. 9. Industrial fumaces with heat exchanger system [53] The recirculation volume flow into the combustion chamber depends on the level of air pre-heating and oxygen dilution needed. EGR will reduce NO,, emissions of the oxygenated fuels by more than 55% since it reduces both the pressure [52] and the maxinum combustion temperature. Figs. 9 and 10 show the industrial fumace with the heat exchanger system and intemal gas recirculation to utilize the flue gas.](https://figures.academia-assets.com/38009008/figure_335.jpg)
![Fig. 10. Industrial closed furnaces with intemal EGR system [54]](https://figures.academia-assets.com/38009008/figure_336.jpg)
![The design of the bumer can be used for various purposes. For the USQ combustion group, the experimental setup is not only for MILD combustion but is also applicable for future studies on combustion and ignition including testing the characteristics of altemative fuels under combustion, for example naturel gas, biogas and coal seam gas. Biogas and LCV fuels are difficult to bum in a conventional combustor, but are readily bumed in MILD mode [4], [67], so the potential exists to lead the world in both open fumace MILD systems and the usage of altemative fuels [32], [38]. This also has great potential for consulting work with local industries to improve their green characteristics, and therefore, could lead to substantial future research and development opportunities. Figs. 12.Temperature distnibution for MILD combustion (a) 3D view (b) 2D view](https://figures.academia-assets.com/38009008/figure_337.jpg)
![Figs. 11. MILD combustion fumace, (a) University of Southem Queensland, Australia [32] (b) University of Adelaide, Australia [44], [67], [70] (c) Politecnico di Milano, Italy [68] The fumaces for MILD combustion are greatly invested at a laboratory scale and at industrial scale; gradual adaptations are taking place for this new technology. Worldwide there are many research labs and universities are conducting further research, an example of this is shown below in Figs. 11. Fig. 11(a) is MILD combustion in an open fumace at University of Southem Queensland (USQ), Australia [31].](https://figures.academia-assets.com/38009008/figure_338.jpg)

![Figs. 2. 2DOF Representation of: (a) Passive Suspension; (b) EMS Suspension The suspension unit consists of a spring and an EMS actuator passive suspension system. The EM actuator was treated as a “black box” that has the ability to produce any amount of force the control system told it to produce. The control strategy will calculate the required force to stabilize the vehicle and feed it to the EM actuator which will supply the required force into vehicle system. For performance comparison, a_ passive suspension system, consisting a passive spring and damper will be used. Figs. 2 show 2DOF models representing the passive suspension setup (a) and EMS suspension setup (b) based on [25]. Here, Frag is the controllable force from EMS actuator.](https://figures.academia-assets.com/38009008/figure_339.jpg)
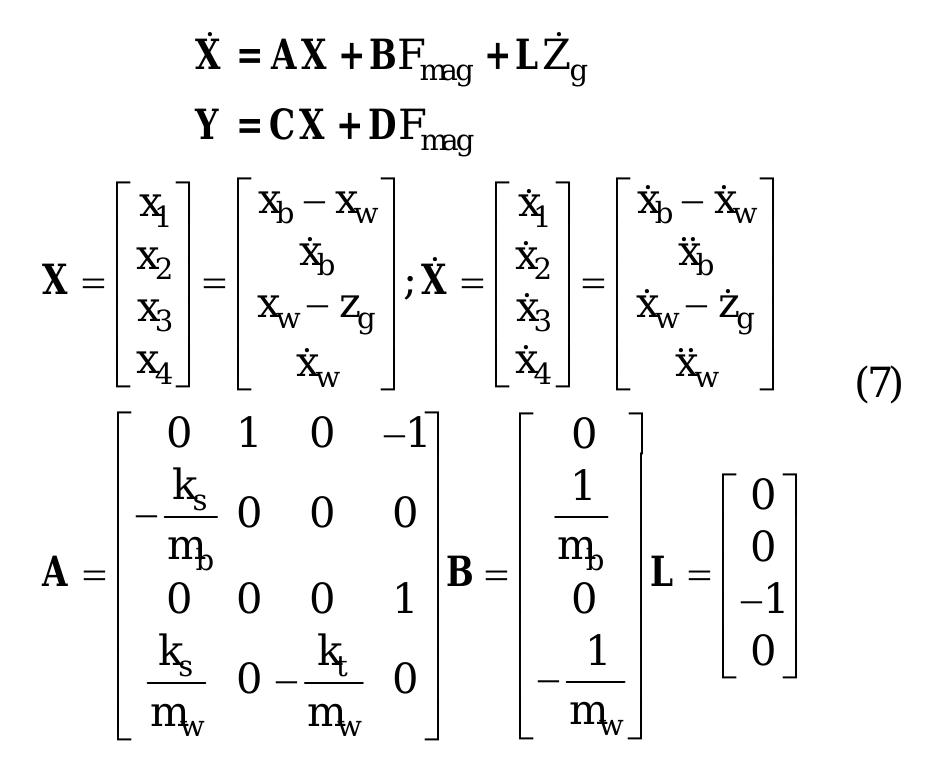
![A performance index was chosen next. It consists of the objective functions to be minimized by the LQR contoller. In this study, an established index from [16] is used as shown in Eq. (6) where qi, dp, g3, and qy are the weighted coefficients of each performance velocity (%,), wheel-road displacement (x,-Z,) and](https://figures.academia-assets.com/38009008/figure_341.jpg)
![The optimization is solved in MATLAB using Ricatti approach as laid out by [16]. The solution will yield the value of K and thus, the optimum input signal Fymg can be obtained by the optimal control law, Frag=-KX. The Fig Value is the unique solution to optimize the performance index in Eq. (8). A MATLAB/SIMULINK model was built and as shown in Fig. 3. Fig. 3. LOR contoller for EMS system There are several conditions for a system to be successfully controlled by LOR strategy. Therefore, a system check should be carried out to ensure the proposed EMS system fulfilled the conditions as listed below.](https://figures.academia-assets.com/38009008/figure_342.jpg)


![This study wes camied'= out within MATLAB/SIMULINK simulation tools. 2 types of road inputs were used, step and random road input. Step input will be modeling a curb of 0.03m height whereby the random input models a realistic approach of a road surface. In this study, the road surface is generated based on employing the roughest road surface profile (Class E) from ISO standard ([26]). Both road models are shown in Fig. 4. Fig. 4. Step and static random input from ISO 8608 - Class E A set of values were assigned to the weighting parameters in the matrix Q. In this study, the values are: q =1, © =90, gq =10 and q,=Owhich were derived based on guidelines from [16], [22]. The initial values and its subsequent K values calculated are shown in Eq. (9). These values give deteriorating body responses and oscillatory wheel responses. To overcome this, a parametric analysis was camied out to give better understanding on the effect of these values:](https://figures.academia-assets.com/38009008/figure_344.jpg)


![Fig. 2. Mechanism of photocatalysis [23] Activation of TiO, is achieved through the absorption of a photon (Av) with ultraband energy from UV irradiation source. This results in the promotion of an electron (e-) from the valence band to the conduction band, with the generation of highly reactive positive holes (h+) in the valence band. This stage is referred as the semiconductor's ‘photo-excitation' state as referred to Fig. 2. The energy difference between the valence band and the conduction band is known as the 'Band Gap. Wavelength of the light necessary for photo-excitation is:](https://figures.academia-assets.com/38009008/figure_352.jpg)
![The similar result was found in the IR spectra of water polyaggregates in a nitrogen cryomatrix [21]. Fig. 3. Overlay spectras of FTIR gas cell of BPF;,o of unexposed 60 minutes and exposed to UV light at 60 minutes](https://figures.academia-assets.com/38009008/figure_353.jpg)
![It has been reported that the nitrogen doped TiO, could improve visible light adsorption efficiency with characterization of catalyst [27]. Fig. 4. Doping mechanism of nitrogen on titanium dioxide [27]](https://figures.academia-assets.com/38009008/figure_354.jpg)
![Figs. 7. Thermal degradation of BPF; o after exposed to UV light at 60 minutes [1]](https://figures.academia-assets.com/38009008/figure_355.jpg)


![Based on Table I, the dominant concentration of fatty acids in T.chuii were SFA and MUFA which in total of 81.67%. Bondioli et al., (2012) [20], has reported in the research on oil production from two marine microalgae species Nannochloropsis and Tetraselmis suieca, that the microalgae species T.suecica (similar species to T.chuii) cultivated under nitrogen and phosphate starvation was mainly consist of MUFA (46.98%) followed by SFA (32.76%) and PUFA (18.94%). An important characteristic for any biodiesel feedstock is the suitability of the fatty acid profile for biodiesel production. Table I shows T.chuii lipids were mainly consist of saturated fatty acids C16:0, palmitic acid (23.1%) and C20:0 arachidic (26.2%), followed by monounsaturated fatty acids such as C15:1 cds10- pentadecenoic (7.7%), C18:1 octadecencic (13.0%) and C22:1 erucic (4.0%). Presence of polyunsaturated fatty acids was detected with C22:2, lignoceric (12.6%), C18:2 linoleic (2.7%), C18:3, a-linoleic (2.3%). Other fatty acids (as shown in Table I) were identified with very less amount of percentages.](https://figures.academia-assets.com/38009008/table_081.jpg)

![However, high content of MUFA is suggested to produce biodiesel which tend to solidify in low temperatures and as for lipid with high PUFA content will have a better cold flow properties but it has low oxidation stability which will eventually affects the storage and combustion of the biodiesel (Imahara et al., 2006; Hu et al., 2008) [26], [27].](https://figures.academia-assets.com/38009008/table_083.jpg)


![This could also be one of the reasons for the low yield strength acquired by the 550 T6 sample as can be seen in Fig. 8. Quenching rate also affect the yield strength of A356 alloy. If the quench rate is high enough, the solute is retained in solid solution and high number of vacancies would also be retained [3]. Conversely, too slow cooling rate cause the particle to precipitate heterogeneously at grain boundaries or at the dislocations; resulting in a decrease in the super saturation of solute and in the same time, resulting in lower yield strength after completing the heat treatment.](https://figures.academia-assets.com/38009008/table_086.jpg)

