T he development of nanocrystals has been intensively pursued, not only for their fundamental scientifi c interest, but also for many technological applications 1-3 . Th e synthesis of monodisperse nanocrystals (size variation <5%) is of...
moreT he development of nanocrystals has been intensively pursued, not only for their fundamental scientifi c interest, but also for many technological applications 1-3 . Th e synthesis of monodisperse nanocrystals (size variation <5%) is of key importance, because the properties of these nanocrystals depend strongly on their dimensions. For example, the colour sharpness of semiconductor nanocrystal-based optical devices is strongly dependent on the uniformity of the nanocrystals 3-6 , and monodisperse magnetic nanocrystals are critical for the next-generation multi-terabit magnetic storage media 7-9 . For these monodisperse nanocrystals to be used, an economical mass-production method needs to be developed. Unfortunately, however, in most syntheses reported so far, only sub-gram quantities of monodisperse nanocrystals were produced. Uniform-sized nanocrystals of CdSe (refs 10,11) and Au (refs 12,13) have been produced using colloidal chemical synthetic procedures. In addition, monodisperse magnetic nanocrystals such as Fe (refs 14,15), Co (refs 16-18), γ-Fe 2 O 3 (refs 19,20), and Fe 3 O 4 (refs 21,22) have been synthesized by using various synthetic methods 23 . Here, we report on the ultra-large-scale synthesis of monodisperse nanocrystals using inexpensive and non-toxic metal salts as reactants. We were able to synthesize as much as 40 g of monodisperse nanocrystals in a single reaction, without a size-sorting process. Moreover, the particle size could be controlled simply by varying the experimental conditions. Th e current synthetic procedure is very general and nanocrystals of many transition metal oxides were successfully synthesized using a very similar procedure.


![Scheme 1. Synthesis of building block A: a) toluene/DMF, [Pd(PPh;),], 85°C; b) 1) LDA, —78°C to room temperature; 2) Bu;SnCl, —78°C to room tem- perature, THF; c) Toluene/DMF, [Pd(PPh;),], 70°C; d) 1) nBuLi, —78°C; 2) Bu;SnCl, —78°C to room temperature, THF. LDA: lithium diisopropyl- amide.](https://figures.academia-assets.com/49965831/figure_002.jpg)

![Scheme 3. Synthesis of OFbTs: a) toluene/DMF, [Pd(PPh;),], 85°C. pling reactions for the synthesis of F7Th12 and F9Th16](https://figures.academia-assets.com/49965831/figure_004.jpg)
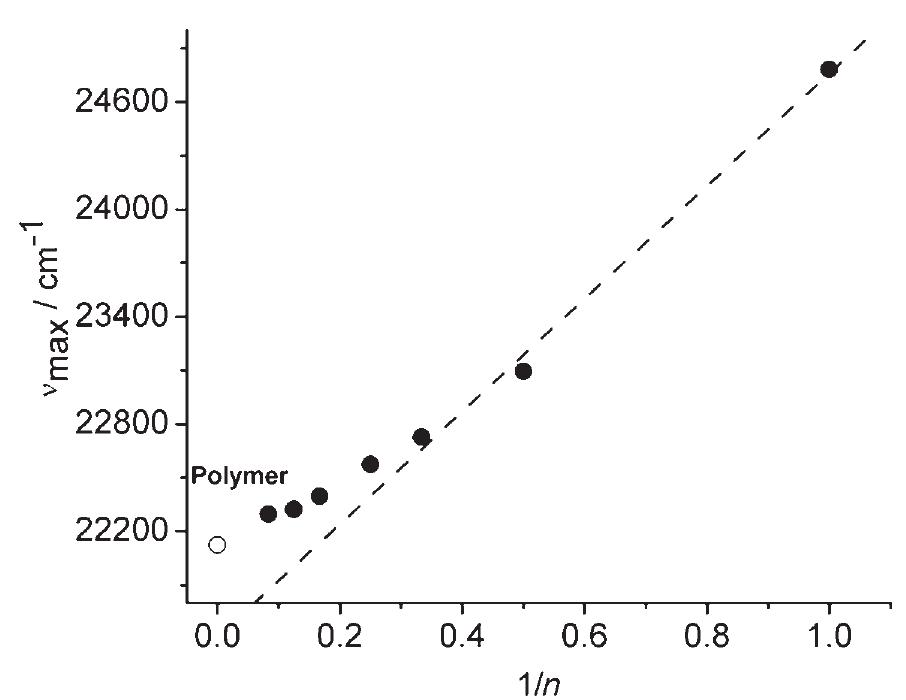
![Figure 2, MALDI-TOF mass spectra ((M+H]*) of oligomers F7Th12, F9Th16, and F13Th24 with anthracene-1,8,9-triol as matrix. The molecular structures of OFbTs were validated by ‘HNMR spectroscopy, gel-permeation chromatography (GPC), and matrix-assisted laser desorption ionization time- of-flight (MALDI-TOF) mass spectrometry (MS), and ele- mental analysis. Molecular weights measured by GPC (weight-average molecular weight M,cpc) and MS (M,.us) along with calculated ones (M.ai-q) are listed in Table 1. The M,ms of all oligomers determined by means of MALDI- Ww,](https://figures.academia-assets.com/49965831/figure_005.jpg)
![Figure 3.'H NMR spectrum of F13Th24 in C,D,Cl, at 20°C, 50°C, and 80°C, with a concentration of 8.5x10~* molL”! (6.0 mgmL'). [a] Measured by MALDI-TOF MS. [b] Measured by GPC with PS as standard. [c] Measured by DSC with second heating at 10°C min '. [d] From refer ence [27].](https://figures.academia-assets.com/49965831/figure_006.jpg)


![[a] Measured in chloroform at a concentration of 10° and 10°° molL”! for absorption and PL, respectively. [b] Band gap calculated from absorptior edge. [c] Measured by cyclic voltammetry. [d] From reference [27]. Table 2. Absorption (Anaxabs) and PL (AmaxpL) maxima of OFbTs in chloroform solution and film state, and energy levels of OFbTs.](https://figures.academia-assets.com/49965831/table_002.jpg)
![SMMs are nanoscale magnetic molecules that exhibit slow relaxation of the magnetization at low temperatures*’. They often crystallize into high-quality crystals, thus allowing for a structural determination and rationalization of their properties. The magnetic properties are described using a spin hamiltonian, which takes the form (= DS? + E(S;- S;) + guguS-H, where S,, S, and S, are the spin components, D and E are the magnetic anisotropy constants, and the term gu/;//)S-H describes the Zeeman energy associated with an applied magnetic field H. Excited spin states and higher-order anisotropy terms are neglected for simplicity. For SMMs, D <0 and an easy axis of magnetization is present along S,. The energy potential takes the form of a double well, with the levels S,, = +S having the lowest energy and a potential barrier in between. To reverse the magnetization, the spin has to overcome a potential energy barrier A = DS? by climbing up and down all the (2S+1) energy levels (Fig. Bla). The relaxation time will thus follow a Figure B1 Dynamics of the magnetization in SMMs. a, Schematic representation of the energy landscape of a SMM with a spin ground state S = 10. The magnetization reversal can occur via quantum tunnelling between energy levels (blue arrow) when the enery levels in the two wells are in resonance. Phonon absorption (green arrows) can also excite the spin up to the top of the potential energy barrier with the quantum number = 0, and phonon emission descends the spin to the second well. b, Hysteresis loops of single crystals of [Mn,,0,,(0,CCH,C(CH,),),,(CH,OH),] SMM at different temperatures and a constant field sweep rate of 2 mT s* (data from ref. 65). The loops exhibit a series of steps, which are due to resonant quantum tunnelling between energy levels. As the temperature is lowered, there is a decrease in th transition rate due to reduced thermally assisted tunnelling. The hysteresis loops become temperature-independent below 0.6 K, demonstrating quantum tunnelling at the lowest energy levels. Owing to their molecular nature, SMMs exhibit some striking quantum effects that affect the magnetization reversal mechanism. One of the most prominent is quantum tunnelling of the magnetization®*'*”. When H is applied along z, levels with S,, < 0 are shifted up and levels with S,,>0 are shifted down. Levels of positive and negative quantum numbers will then cross at H = 0 and at certain resonance fields. Transverse terms, containing Si or Sy turn the crossings into an avoided level-crossing and quantum tunnelling between the two wells can occur (Fig. Bla). The availability of this additional tunnelling mechanism for the relaxation of the magnetization produces the characteristic steps at the resonance fields in the hysteresis curve of SMMs (Fig. B1b).](https://figures.academia-assets.com/67021303/figure_001.jpg)


![Figure 2 Transport experiments on SMMs. a, Schematic showing the use of an STM tip to perform transport experiments on surface-grafted SMMs. b, Schematic of SMM-based molecular transistors, in which a gate voltage can modulate transport. e, [Co(TerPy),] mononuclear magnet molecule with alkyl spacers, permitting transport in the weakly coupled regime*'. d, [Co(TerPy),] without spacers, showing strong coupling and the Kondo effect*'. e, Divanadium [(N,M’,W’-trimethyl-1 ,4,7-triazacyclononane),V,(CN), (u-C,N,)] molecular magnet showing the Kondo effect only in the charged state**. The colour code is the same as for Fig. 1, except for Co atoms (green) and V atoms (orange).](https://figures.academia-assets.com/67021303/figure_004.jpg)
![Figure 3 Spin valves based on molecular magnets. Yellow arrows represent the nagnetization direction. a, Parallel configuration of the magnetic source electrode orange) and molecular magnetization, with diamagnetic drain electrode (yellow). Spin-up majority carriers (thick green arrow) are not affected by the molecular nagnetization, whereas the spin-down minority carriers (thin blue arrow) are partially eflected back. b, Antiparallel configuration: majority spin-up electrons are only yartially transmitted by the differently polarized molecule, whereas the minority spin-down electrons pass unaffected. Assuming that the spin-up contribution to the urrent is larger in the magnetic contact, this configuration has higher resistance han that of the previous case. e, Theoretical schematic of a spin-valve configuration vith non-magnetic metal electrodes’ and d, proposed molecular magnet (C,H,)Co(C,H,-CCCH,CH,CC-C;H,)Fe(C;H,)] between gold electrodes: a conjugated nolecule bridges the cobaltocene (red) and ferrocene (blue) moieties*’.](https://figures.academia-assets.com/67021303/figure_005.jpg)


![Fig. 1. Structures of cellulose, chitin and chitosan. chitin, chitosan and their derivatives. However, these naturally abundant materials also exhibit a limitation in their reactivity and processability [3,4]. In this respect, chitin and chitosan are recommended as suitable functional materials, because these natural polymers have excellent properties such as biocompatibility, biodeg-](https://figures.academia-assets.com/49089022/figure_001.jpg)

![Fig. 2. Controlled drug delivery versus immediate release. Chitosan is non-toxic and easily bioabsorb- able [74] with gel-forming ability at low pH. Moreover, chitosan has antacid and antiulcer activities which prevent or weaken drug irrita-](https://figures.academia-assets.com/49089022/figure_003.jpg)


![*Pyroceram, Corning Glass Works, Corning, N. Y. Commercial sheet glass. ‘National Bureau of Standards, Washington, D. C. “Coors Porcelain Co., Golden, Colo. ‘Vistal, Coors Porcelain Co. ‘Linde, Union Carbide Co., New York, N. Y. §Norton Co., Worcester, Mass. "CSIRO, Australia. ‘Texas Instruments, Inc., Dallas. ‘Rods, [0001] 30° to axis. "Disks, [111] parallel to axis. ‘DT=double torsion, DCB=double cantilever beam. “University of California, Berkeley. ‘Rockwell International Science Center, Thousand Oaks, Calif. ‘National Bureau of Standards. Table I. Materials Used in Indentation Toughness Studies](https://figures.academia-assets.com/18899875/table_001.jpg)


![Figure 9 Filamentary structure induced by electroformation in an undoped SrTiO, single crystal. From ref. 55. a, Optical micrograph of the filamentary structure created in the skin region of a thermally pre-reduced crystal by electroformation between planar gold electrodes. Segments from left to right: near the cathode, in the central region, and near the anode. Clearly visible is the orthogonal network along the crystallographic [100] direction of the crystal. Insets show the possible fine structure of filaments at the cathode (left) and gas bubble that have developed under the anode metal (right). b, High resolution of the scene as recorded by C-AFM at a location between the electrodes, where filaments have terminated at the surface. Measurements support the filamentary character of conductance and the fine structure of the high-conductivity spots. ¢, Etch pits of the same kind of crystal give an example of the distribution of dis! ocations crossing the surface, highlighting the natural tendency to agglomerate along crystallographic directions.](https://figures.academia-assets.com/48305385/figure_009.jpg)


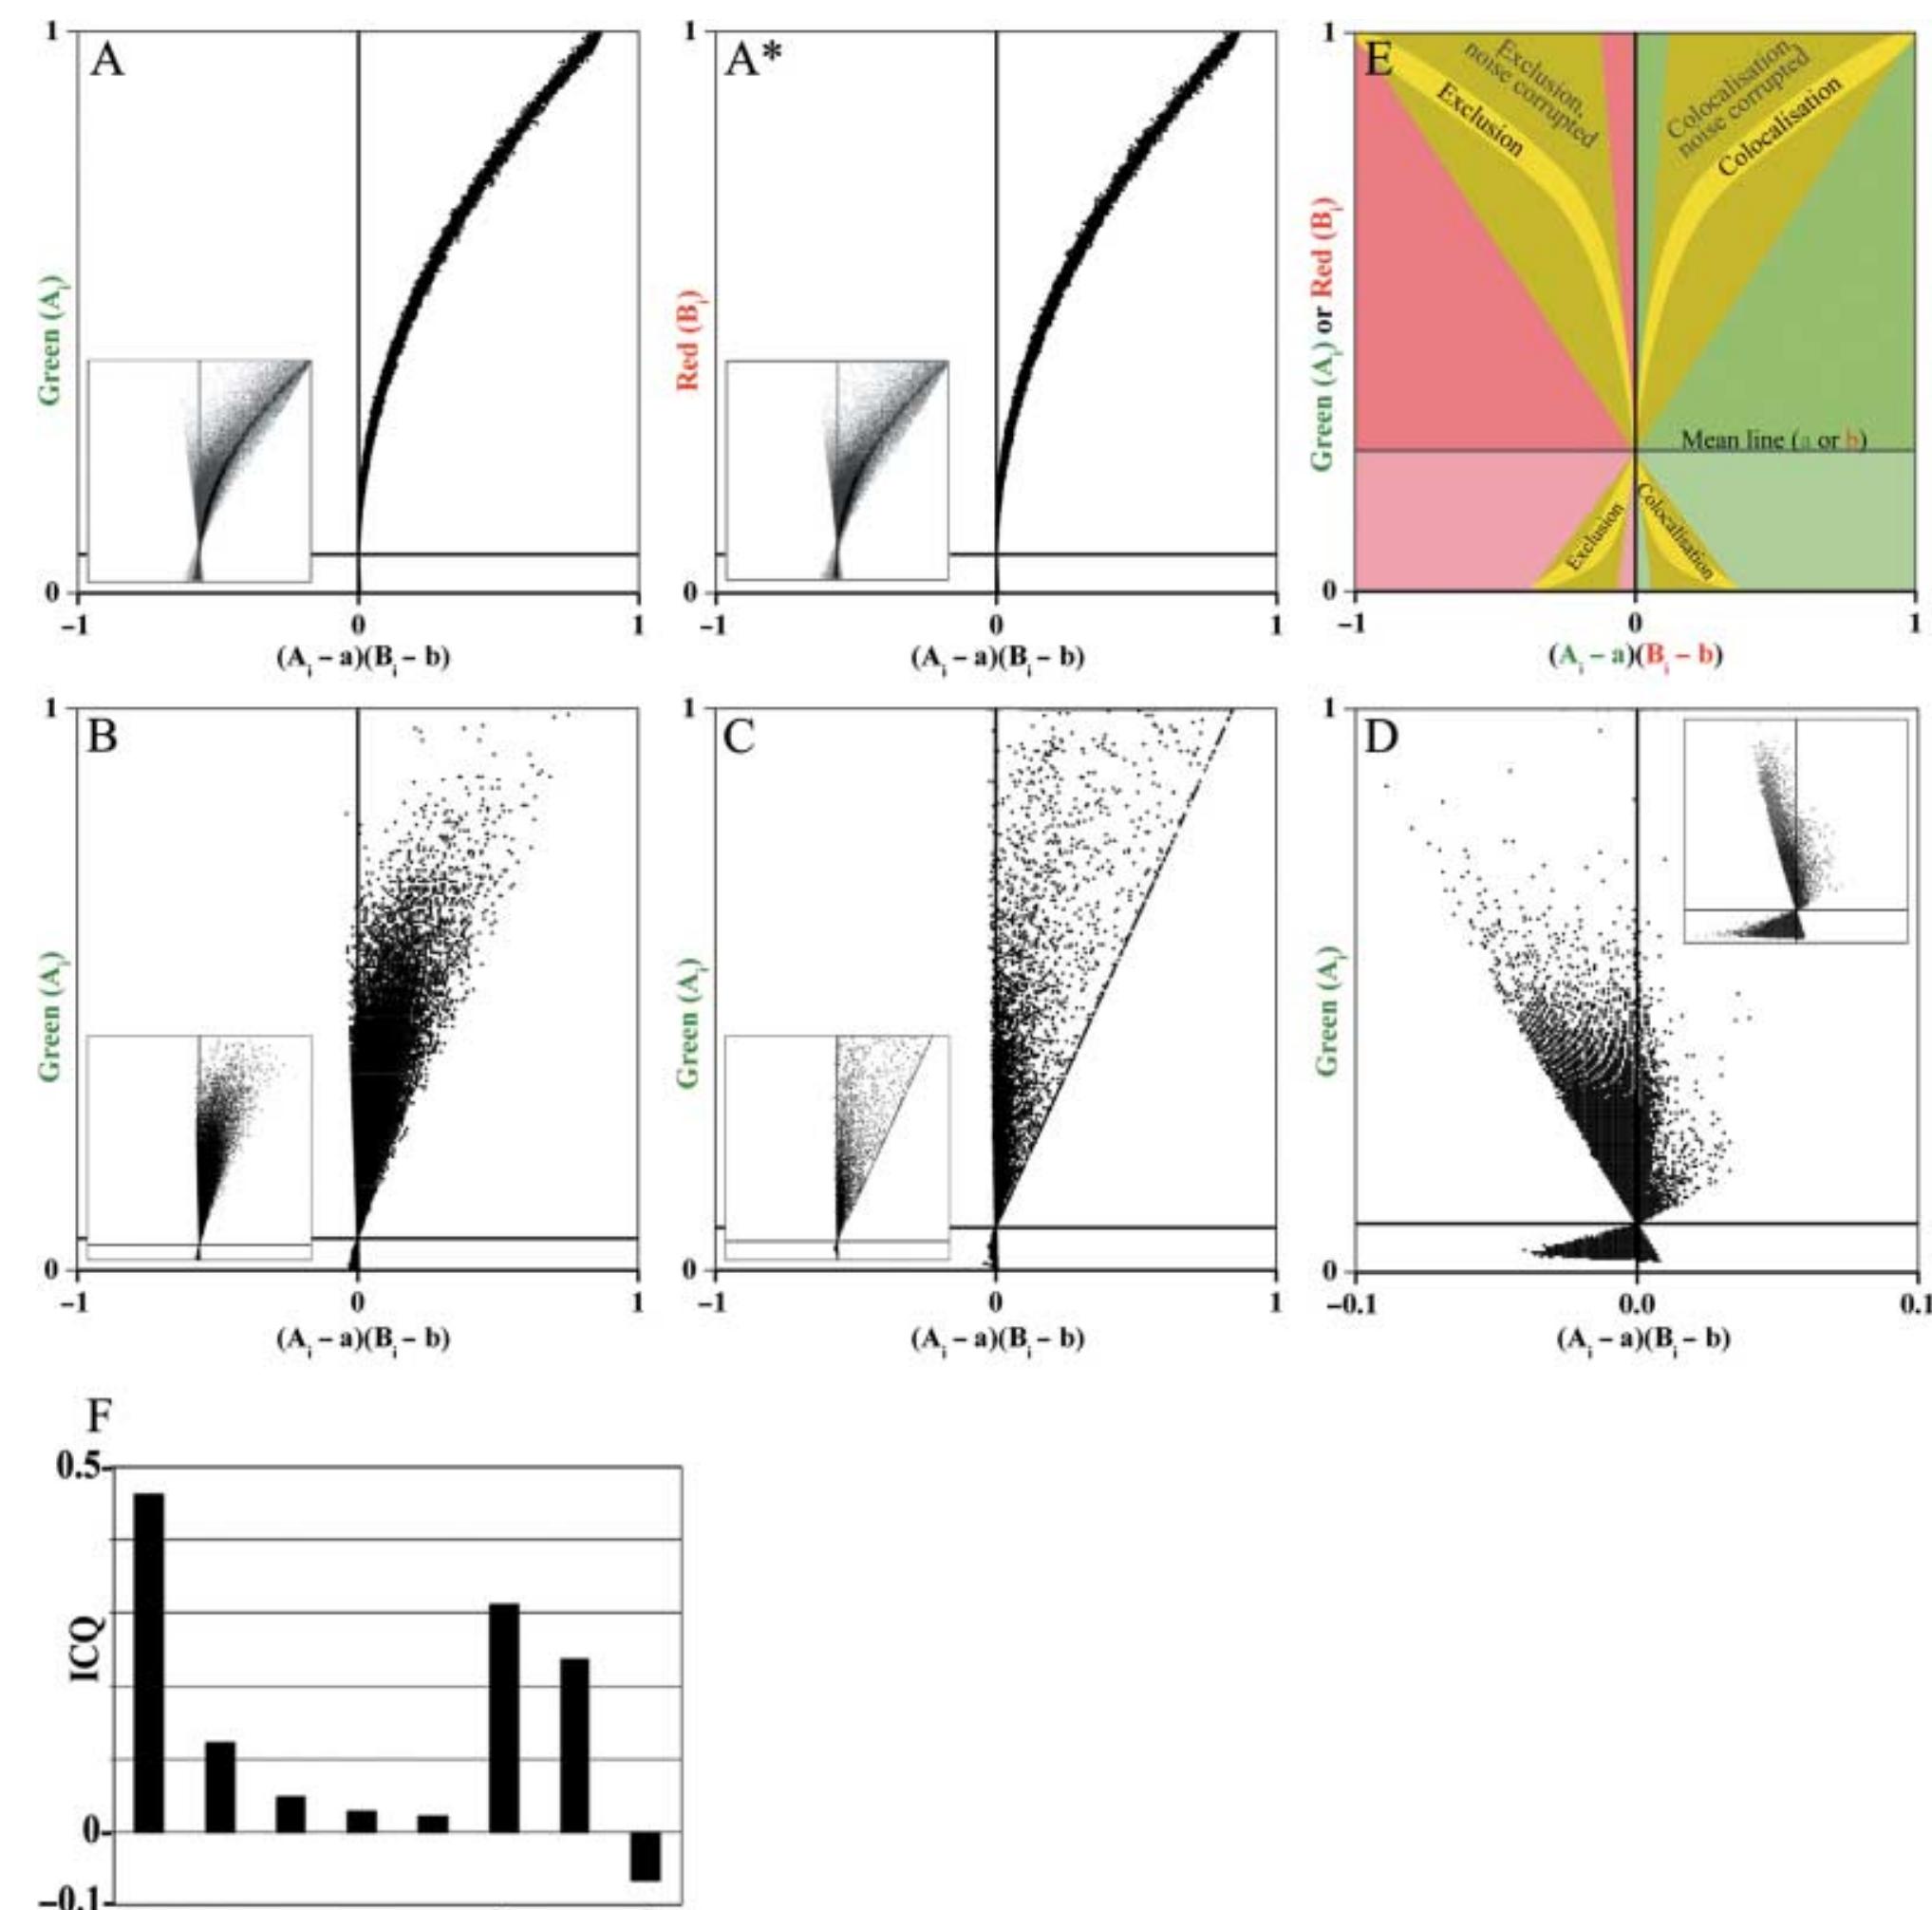
![Fig. 5. Colocalization analysis with JACoP; Pearson and Manders, scatter plots and correlation coefficients. Scatter plots (A—D) correspond to the colocalization events as shown in Fig. 4. (E) Model scatter plot explaining the effects of noise and bleed-through. (F) Pearson’s and Manders’ coefficients in the different colocalization situations. A complete colocalization results in a pixel distribution along a straight line whose slope will depend on the fluorescence ratio between the two channels and whose spread is quantified by the Pearson’s coefficient (PC), which is close to 1 as red and green channel intensity distributions are linked (F, a,, black bar). (B) A difference in fluorescence intensities leads to the deflection of the pixel distribution towards the red axis. Note that the PC diminishes even if complete colocalization of subcellular structures is still given (F, b, black bar). (C) In a partial colocalization event the pixel distribution is off the axes and the PC is less than 1 (F,c, black bar). (D) In exclusive staining, the pixel intensities are distributed along the axes of the scatter plot and the PC becomes negative (F, d, black bar). This is a good indicator for a real exclusion of the signals. (E) The effect of noise and bleed-through on the scatter plot is shown in the general scheme. (F) The influence of noise on the PC was studied by adding different levels of random noise (n1-n4)* to the complete colocalization event (A = n0, no noise). (F) Note that the PC (black bar) tends to O when random noise is added to complete colocalizing structures. The inset (A*) in (A) shows the scatter plot for the n2 noise level. Note that all of the mentioned colocalization events (A—D) may only be detected faithfully once images are devoid of noise. (F) Manders’ coefficients were calculated for (A—D). The thresholded Mander’s tM, (cross-hatched bars) and tM, (diagonal hatched bars) are shown. Compare complete colocalization (a, ), complete colocalization with random noise added (a,,;—a,,4), and complete colocalization with different intensities (b), partial colocalization (c) and exclusion (d). Note that the original Manders’ coefficients are not adapted to distinguish between these events, as they stay close to 1 for all situations (not shown). *Signal-to-noise ratios are: n] = 12.03 dB, n2 = 6.26 dB, n3 = 4.15 dBandn4 = 3.52 dB.](https://figures.academia-assets.com/76163092/figure_005.jpg)


![Fig. 4. The density phase transition curve of MD simulation. The phase transition of ZrO, is very complicated, but it is a good choice for MD algorithm checking. With a heat- ing rate of 10 from 2100 to 3000 K, the phase transition from tetragonal to cubic is simulated successfully by a MD process starting with a tetragonal sample. The variations of the density are plotted in Figure 4. Note that a similar curve has been given in Ref. [17] where the pressure was controlled by a scaling of the MD cell, which could not be verified to yield the correct NPT ensemble. Figure 5 depicts the variations of the effective axial ratio of (a+ b)/2c. From the phase diagrams, transition from tetrago- nal to cubic can be identified easily. In Figure 5, due to the initialization of tetragonal phase, the axial ratio (0.922)](https://figures.academia-assets.com/45335064/figure_006.jpg)


![This model assumes only concentration gradients, not total pressure gradients, across the electrodes. (A pressure drop can occur across the membrane if the anode and cath- ode pressures are different). From Eq. [9] we obtain the fol- lowing differential equations for x,,4 across the anode and for Ywc and Xoc across the cathode Equation [11] can be integrated across the anode thickness, ts, from the initial condition of x, = x, at z = 0 at inter- face 1, which we know from Eq. [8], to obtain x,» at z = ta at interface 2](https://figures.academia-assets.com/5406801/figure_002.jpg)
![Fig. 2. Measured membrane water content vs. water activity for Nafion 117 at 30°C and according to Eq. [16].](https://figures.academia-assets.com/5406801/figure_003.jpg)
![Equation [24] can be integrated numerically from interface 2, where d, is determined by xy. and Eq. [14]. This allows us to calculate A3 and x3. The net water flux through the membrane is The activation energy of Eq. [22] was based on meas- urements of Yeo and Eisenberg (14) on water diffusion in acid from Nafion of 1155 equivalent weight. i i i a a i A](https://figures.academia-assets.com/5406801/figure_004.jpg)


![Fig. 1. Typical concentrations (moles per liter) of known chemical components (molecular weight less than 1000) in human blood serum [1]. If a TAS performs all sample handling steps extremely close to the place of measurement, then we propose that it be called a ‘miniaturized total](https://figures.academia-assets.com/40445214/figure_001.jpg)


![Fig. 6. Detection limits as a function of the detection volume for refractive index, potentiometric and fluorescence detectors. FIA: flow injection analysis, LC: conventional liquid chro- matography, SFC: capillary supercritical fluid chromatogra- phy, CZE: capillary zone electrophoresis, LC ETH: capillary LC [12], LC CHIP HITACHI: see ref. 7.](https://figures.academia-assets.com/40445214/figure_007.jpg)


![Figure 3. (a) External quantum efficiency (EQE) for the new perovskite, dye sensitised and organic (OPV) results in this issue (* asterisk denotes normalized values; others are absolute values); (b) corresponding current density-voltage (JV) curves. 3. DISCLAIMER Table IV also reports two new results for concentrating modules and submodules, with performance based on out- door measurements. A landmark 40.4% efficiency has been measured in outdoor testing by NREL for a 287-cm* split- spectrum concentrator submodule fabricated by the Univer- sity of New South Wales (UNSW), using commercial GalnP/GalnAs/Ge and Si cells manufactured by Spectrolab and SunPower, respectively. A new record of 36.7% is re- ported for an 830-cm” photovoltaic module using a four cell stack [24]. The module was fabricated and measured at the Fraunhofer Institute for Solar Energy Systems (FhG-ISE).](https://figures.academia-assets.com/43090489/figure_003.jpg)


![*Effic. = efficiency. ®(da) = designated illumination area; (ap) = aperture area. °One sun corresponds to direct irradiance of 1000 Wm”. 4Not measured at an external laboratory. °Spectral response reported in Version 36 of these tables. ‘Measured under a low aerosol optical depth spectrum similar to ASTM G-173-03 direct [61]. °Spectral response and current-voltage curve reported in Version 44 of these tables. Spectral response and current-voltage curve reported in present version of these tables. ‘Measured outdoors at 883.7 Wim? direct irradiance, pressure-corrected airmass of 2.5 and cell temperature referenced to 25°C. 'Recalibrated from original measurement. ‘Referenced to 1000 Wim> direct irradiance and 25 °C cell temperature using the prevailing solar spectrum and an in-house procedure for temperature translatic 'Measured under IEC 62670-1 reference conditions following the current IEC power rating draft 62670-3. ™Geometric concentration. Table IV. Terrestrial concentrator cell and module efficiencies measured under the ASTM G-173-03 direct beam AM1.5 spectrum at a cell temperature of 25 °C.](https://figures.academia-assets.com/43090489/table_004.jpg)


