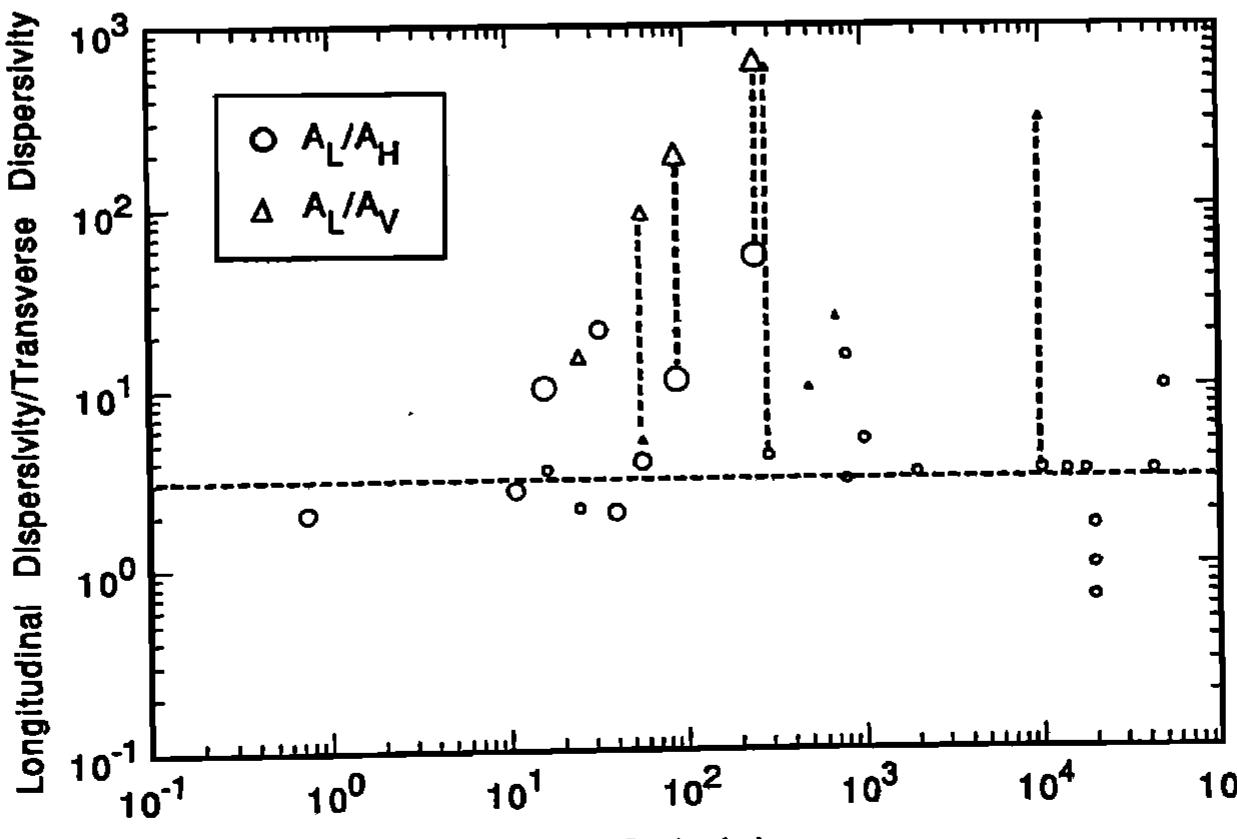
A critical review of dispersivity observations from 59 different field sites was developed by compiling extensive tabulations of information on aquifer type, hydraulic properties, flow configuration, type of monitoring network, tracer,...
moreA critical review of dispersivity observations from 59 different field sites was developed by compiling extensive tabulations of information on aquifer type, hydraulic properties, flow configuration, type of monitoring network, tracer, method of data interpretation, overall scale of observation and longitudinal, horizontal transverse and vertical transverse dispersivities from original sources. This information was then used to classify the dispersivity data into three reliability classes. Overall, the data indicate a trend of systematic increase of the longitudinal dispersivity with observation scale but the trend is much less clear when the reliability of the data is considered. The longitudinal dispersivities ranged from 10 -2 to 10 4 m for scales ranging from 10 -1 to 105 m, but the largest scale for high reliability data was only 250 m. When the data are classified according to porous versus fractured media there does not appear to be any significant difference between these aquifer types. At a given scale, the longitudinal dispersivity values are found to range over 2-3 orders of magnitude and the higher reliability data tend to fall in the lower portion of this range. It is not appropriate to represent the longitudinal dispersivity data by a single universal line. The variations in dispersivity reflect the influence of differing degrees of aquifer heterogeneity at different sites. The data on transverse dispersivities are more limited but clearly indicate that vertical transverse dispersivities are typically an order of magnitude smaller than horizontal transverse dispersivities. Reanalyses of data from several of the field sites show that improved interpretations most often lead to smaller dispersivities. Overall, it is concluded that longitudinal dispersivities in the lower part of the indicated range are more likely to be realistic for field applications. --+vi•=• Dij at Oxi Oxi i,j= 1, 2, 3 (1) where c is the solute concentration, v i is the seepage velocity component in the xi direction, and Dij are the components of the dispersion coefficient tensor. The fighthand side of (1) represents the net dispersive transport which is presumed to be Fickian, i.e., the dispersive mass flux is proportional to the concentration gradient. Some investigators [e.g., Robertson and Barraclough, 1973; Bredehoeft and Pinder, 1973] alternatively define the dispersion coefficient tensor including the porosity n as D•j =nD ij. When it was clear that D•j was used in a study, we converted to the more common form used in (1). The mean flow direction is taken to be Xl, with vl = v, v2 = v3 = 0. Assuming that xl, x2, and x 3 are principal directions, the dispersivity is simply the ratio of the appropriate component of the dispersive coefficient tensor divided by the magnitude of the seepage velocity, v. To distinguish the field-scale dispersivities from laboratory values, the field-scale values are designated by the uppercase letter A [see Ge!har and Axness, !983] and, to allow for anisotropy of transverse dispersion, a third dispersivity coefficient is used as follows: Dll = ALV D22 = Arv D33 = Avv (2) where A t• is the longitudinal macrodispersivity (field scale), and A T is the horizontal transverse macrodispersivity, and A v is the vertical transverse macrodispersivity. The classical equation (1) with macrodispersivities (2) is standardly used for applied modeling of field-scale solute transport. The macrodispersivities are considered to be a property of some region of the aquifer. Although the macrodispersivity may be a function of space, in most applications it is assumed constant over a region of the aquifer that encompasses the entire plume both horizontally and vertically. Real solute plumes are observed to be threedimensional [LeBlanc, 1982; Perlmutter and Lieber, 1970; MacFarlane et al., 1983] and often of limited vertical extent. Although the classical equation is three-dimensional, the two-dimensional form is most commonly applied. Reasons for the use of the two-dimensional form of the equation include lack of three-dimensional data and in the case of Geophys. Res., 72(16), 4081-4091, 1967. Wilson, L. G., Investigations on the subsurface disposal of waste effluents at inland sites, Res. Develop. Progress Rep. 650, U.S.


![Figure 2: A single single degree of freedom system: Comparison of the predicted chatter limit with the published data (Minis and Yanu- shevsky [1993], analog data is from Opitz [1968] and Sridhar et al. [1968]).](https://figures.academia-assets.com/41872735/figure_003.jpg)
![Milling with a 2-DOF Cutter : A two DOF milling system example is taken from Smith and Tlusty [12]. This is a half immersion-up milling of Figure 3: Analytical, multi frequency and time domain stability limit predictions for a case an- alyzed by Smith and Tlusty [1990].](https://figures.academia-assets.com/41872735/figure_004.jpg)


![Lists of adsorption isotherms models. energy distribution, with most of its sites has an adsorption energy lower than the peak (maximum) or mean value [23]. Table 1 in homogeneous or heterogeneous systems due to its versatility [22]. Typically, a minimization procedure is adopted in solving the equations by maximizing the correlation coefficient between the experimental data points and theoretical model predictions with solver add-in function of the Microsoft excel [26]. In the limit, it approaches Freundlich isotherm model at high concentration (as the exponent # tends to zero) and is in accordance with the low concentration limit of the ideal Langmuir condition (as the 6 values are all close to one) [67].](https://figures.academia-assets.com/34054642/table_001.jpg)


![Fig. 1. Areas of research in thermal storage systems [1]. equipment or in installations with reduced prices for electrical energy consumed during off-peak hours. Nowadays, security of energy supply is often achieved with extra equipment. The use of phase change materials (PCMs) could either avoid or reduce this extra equipment. As it will be seen later in this paper, thermal inertia and thermal protection is the area where the PCMs have achieved a higher penetration in the market. Low mama wrens an oo eaviraw AP ao¢isdéan dan Geaw «oth "TEO aoadnnw whaon nhawewsa ewotacsale Tha](https://figures.academia-assets.com/30356449/figure_001.jpg)
![Fig. 2. Classification of energy storage materials [1].](https://figures.academia-assets.com/30356449/figure_002.jpg)


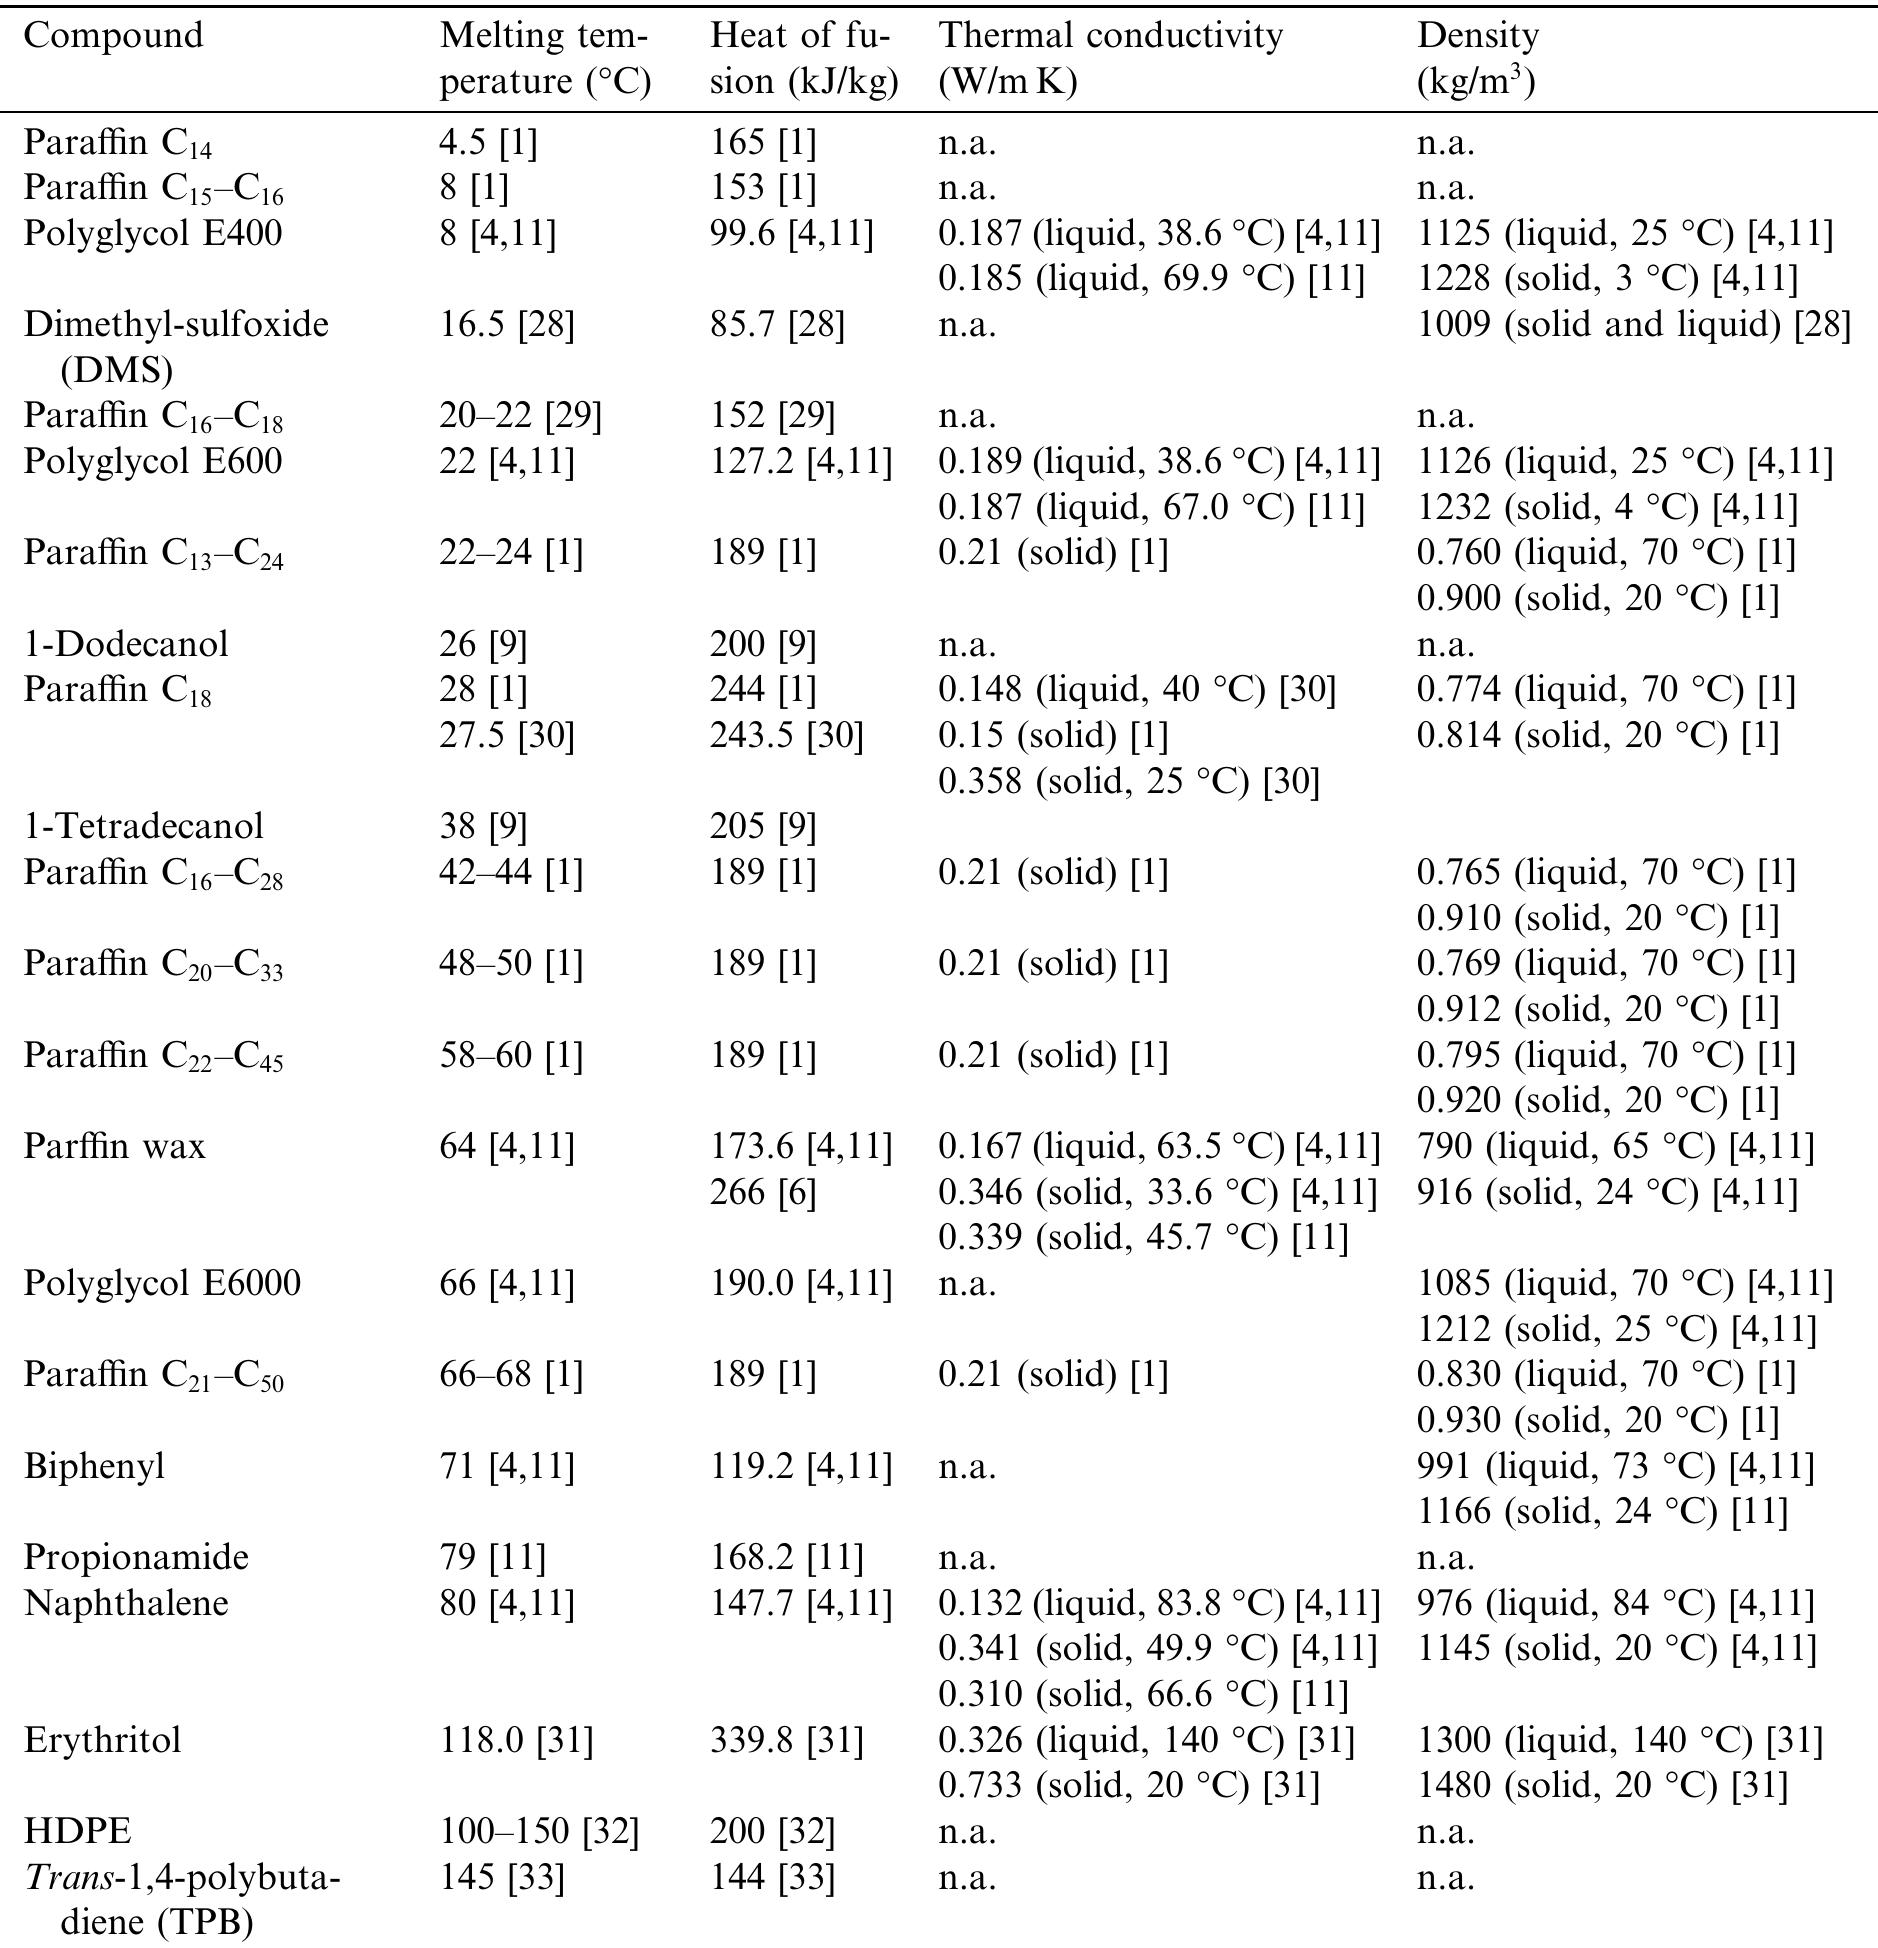
![Table 1 (continued) n.a.: not available. B. Zalba et al. | Applied Thermal Engineering 23 (2003) 251-283 a a Pa as As far as concerns the storage temperature or phase change, the heat transfer in accumulators can be improved choosing the PCM in such a way that its phase change temperature optimises the thermal gradient with respect to the substance with which the heat is being exchanged (Farid [46], Hassan [64], Strub [65]). For example, with paraffins and alkanes it is possible to vary the number of carbon atoms or form different molecular alloys which allows a practically continuous varia- tion of the phase change temperature within certain ranges.](https://figures.academia-assets.com/30356449/table_003.jpg)


![Organic eutectics with potential use as PCM Table 5 on observation over experimental set-ups [78,79]. Porisini [80] tested the corrosion of four com- mercially available salt hydrates used as PCMs in 1988. Recently, Cabeza et al. [81-84] studied corrosion resistance of five common metals (aluminium, brass, copper, steel and stainless steel) in contact with molten salt hydrates (zinc nitrate hexahydrate, sodium hydrogen phosphate do- decahydrate, calcium chloride hexahydrate, sodium carbonate, potassium hydrogen carbonate, potassium chloride, water, sodium acetate trihydrate, and sodium thiosulphate pentahydrate) in an immersion corrosion test. ot @ a ee a | ay i rr ee o a, a, er, ee ey](https://figures.academia-assets.com/30356449/table_007.jpg)


![B. Zalba et al. | Applied Thermal Engineering 23 (2003) 251-283 In the past, the earliest works basically concentrated on analysing pure substances, often water (for ice stores). Studies that can be cited include London [98], Goodman [162], Lazaridis [100] and Saitoh [163]. In subsequent years, and even quite recently and due to the implementation on a commercial and industrial scale of the so-called ice storage systems, abundant information re- lating to water as a storage substance has also appeared i in the literature. we ite: Pn a aa Pa ee qe](https://figures.academia-assets.com/30356449/table_012.jpg)
![WHT EM VVELU GE SELULOsS LM MIC Gi LU Ue CHU Le PCeLivy of the evaluation. Note, however, that the coefficient of deter- mination is limited in that it standardizes for differences be- tween the observed and predicted means and variances since it only evaluates linear relationships between the variables. It can be easily demonstrated that if P, = (AO, + B) for any nonzero value of A and any value of B, then R? = 1.0. Thus R? is insensitive to additive and proportional differences be- tween the model simulations and observations [see Willmott, 1984]. Large values of R? can be obtained even when the model-simulated values differ considerably in magnitude (i.e., values of B that differ significantly from 0.0) and variability (i.e., values of A that differ significantly from 1.0). Clearly, in such cases, a model would exhibit serious flaws that should preclude the attribution of a “perfect” designation. These lim- itations in the coefficient of determination and other correla- tion-based measures are well documented [cf. Willmott, 1981; Moore, 1991; Kessler and Neas, 1994; Legates and Davis, 1997], although such measures still have been used recently to pro- vide, for example, an assessment of climate change detection [e.g., Santer et al., 1995; Hegerl et al., 1996; Santer et al., 1996] and hydrological and hydroclimatological applications (see McCuen and Snyder [1975] and Willmott [1984] for some ex- amples).](https://figures.academia-assets.com/43785224/figure_001.jpg)
![where j represents an arbitrary power (i.e., a positive integer). Note that the original index of agreement d developed by Willmott [1981] becomes d, using this notation.](https://figures.academia-assets.com/43785224/figure_002.jpg)
![where O’ is the baseline value of the time series against which the model is to be compared. It usually is a function of time and, in some applications, may be a function of other variables as well. Consequently, d{, is useful in that its interpretation is more conventional, as it more closely follows the interpretation Garrick et al. [1978, p. 376] further argued that the assump- tion of comparing the model to the observed mean was “un- necessarily primitive.” Better methods exist to define the base- line against which a model should be compared. For example, persistence or averages that vary by season or another time period (i.e., a climatology) may provide a more appropriate baseline for most hydrological or hydroclimatological studies than simply the average of the entire time series. Thus both E, and d, can be rewritten in a “baseline adjusted” form as](https://figures.academia-assets.com/43785224/figure_003.jpg)

![Figure 1. Time series of monthly potential evapotranspiration estimated by the Thornthwaite [1948], Jensen and Haise [1963], and van Bavel [1966] methods compared with observations (measured pan evaporation multiplied by a pan coefficient of 0.76). Data were taken from January 1981 through December 1983 for southern Louisiana (data from McCabe and Muller [1987]).](https://figures.academia-assets.com/43785224/figure_005.jpg)

![Figure 3. Observed and modeled monthly runoff (precipitation runoff modeling system) for the East River Basin in southwestern Colorado from October 1972 through September 1989 (data from McCabe and Hay [1995]).](https://figures.academia-assets.com/43785224/figure_007.jpg)


![Maleated coupling agents are widely used to strength- en composites containing fillers and fiber reinforce- ments [51-54]. The difference with other chemical treatments is that maleic anhydride is not only used to modify fiber surface but also the PP matrix to achieve better interfacial bonding and mechanical properties in composites [55-57]. The PP chain permits maleic anhydride to be cohesive and produce maleic anhy- dride grafted polypropylene (MAPP). Then the treat- ment of cellulose fibers with hot MAPP copolymers provides covalent bonds across the interface (Fig. 1). The mechanism of reaction of maleic anhydride with PP and fiber can be explained as the activation of the](https://figures.academia-assets.com/50156295/figure_001.jpg)
![Most permanganate treatments are conducted by using potassium permanganate (KMnO,) solution (in acetone) in different concentrations with soaking duration from 1 to 3 min after alkaline pre-treatment [10, 23, 48, 49, 54]. Paul et al. [10] dipped alkaline- treated sisal fibers in permanganate solution at con- centrations of 0.033, 0.0625 and 0.125% in acetone for 1 min. As a result of permanganate treatment, the hydrophilic tendency of the fibers was reduced, and thus, the water absorption of fiber-reinforced composite decreased. The hydrophilic tendency of fiber decreased as the KMnO, concentrations increased. But at higher KMnO, concentrations of 1%, degradation of cellulosic Mohanty et al. [59] used MAPP as coupling agent for the surface modification of jute fibers. It has been found that a 30% fiber loading with 0.5% MAPP concentration in toluene and 5 min impregnation time with 6 mm average fiber lengths gave the best results. A 72.3% increase in flexural strength was observed with the treated composites. In addition to PP matrix, Mishra et al. [60] reported that maleic anhydride treatment reduced the water absorption to a great extent in banana, hemp and sisal fiber-reinforced novolac composites. Mechanical properties like Young’s modulus, flexural modulus, hardness and impact strength of plant fiber-reinforced composites increased after maleic anhydride treatment.](https://figures.academia-assets.com/50156295/figure_002.jpg)
![Fig. 2 The reaction pathway for the preparation of urethane derivative of cardanol [23]](https://figures.academia-assets.com/50156295/figure_003.jpg)
![Sodium chlorite (NaClO,) usually is used in bleaching fibers; however, it could delignify ligno- cellulosics. Studies have been conducted wherein it was used in fiber surface treatment for composites. Mishra et al. [65] dipped untreated sisal fiber, for use in sisal-PS biocomposites, in sodium _ chlorite Joseph and Thomas [23] studied the chemical treatment of cardanol derivative of toluene diisocya-](https://figures.academia-assets.com/50156295/figure_004.jpg)
![composition may differ with the growing condition and test methods even for the same kind of fiber. Cellulose is a semicrystalline polysaccharide made up of pD- glucopyranose units linked together by f-(1-4)-gluco- sidic bonds [19]. And the large amount of hydroxyl group in cellulose gives natural fiber hydrophilic properties when used to reinforce hydrophobic matri- ces; the result is a very poor interface and poor resistance to moisture absorption [20]. Hemicellulose is strongly bound to cellulose fibrils presumably by hydrogen bonds. MHemicellulosic polymers are branched, fully amorphous and have a significantly lower molecular weight than cellulose. Because of its open structure containing many hydroxyl and acetyl groups, hemicellulose is partly soluble in water and hygroscopic [16]. Lignins are amorphous, highly com- plex, mainly aromatic, polymers of phenylpropane units [19] but have the least water sorption of the natural fiber components [16]. Rananca tha law: tnftartacial nranartiac hoatrnan Ghar optimize the interface of fibers. Chemicals may acti- vate hydroxyl groups or introduce new moieties that can effectively interlock with the matrix. The devel- opment of a definitive theory for the mechanism of bonding by chemicals in composites is a complex problem. Generally, chemical coupling agents are molecules possessing two functions. The first function is to react with hydroxyl groups of cellulose and the second is to react with functional groups of the matrix. Bledzki and Gassan [9] outlined several mechanisms of coupling in materials, namely: (a) elimination of weak boundary layers; (b) production of a tough and flexible layer; (c) development of a highly crosslinked inter- phase region with a modulus intermediate between that of substrate and of the polymer; (d) improvement of the wetting between polymer and substrate; (e) formation of covalent bonds with both materials; and (f) alteration of acidity of substrate surface. Chemical modifications of natural fibers aimed at improving the adhesion with a polymer matrix were investigated by a number of researchers [4, 21-24]. However, different chemicals were used and very limited papers [9, 18] took a partial review on the Because the low interfacial properties between fiber and polymer matrix often reduce their potential as reinforcing agents due to the hydrophilic nature of natural fibers, chemical modifications are considered to](https://figures.academia-assets.com/50156295/table_001.jpg)


![Fig. 13. Concept on design of engineered natural/biofiber. The significant attraction of biofibers is their low cost; surface treatments that avoid using organic solvents i.e., water-based sizing, alkali treatment, and silane treatments, are logical approachs [29] to making reactive biofiber. Superior-strength bio-composites can be obtained through application of the reactive engineered natural fibers concept [30]. Design of engineered natural/ Biofiber is schematically represented in Fig. 13. Engi- neered biofibers are defined as the suitable blend of sur- face-treated bast (e.g., kenaf, hemp) and a leaf fiber (e.g., pineapple leaf fiber [PALF]). Selection of blends of bio- fibers is based on the fact that the correct blend achieves](https://figures.academia-assets.com/45319984/figure_012.jpg)


![Scheme 1. Proposed structures for monomeric vanadyl species [46-49] and polymeric metavanadate species [51] in their dehydrated forms on the surface of VO5-TiO> catalysts.](https://figures.academia-assets.com/47795844/figure_001.jpg)
![Fig. 1. NO conversion versus temperature over: (a) WO3(9)/TiO3; (b) V205(0.78)/TiO2; (c) V205(1.4)/TiO2; (d) V205(0.78)-WO3(9)/TiO2; (e) V205(1.4)-WO3(9)/TiO>. Experimental conditions: catalyst weight, 160 mg (60-100 mesh); P=1 atm; flow rate=60 Ncc/min; feed: He+800 ppm NH3+800 ppm NO +1% O32. Reprinted with permission from [14].](https://figures.academia-assets.com/47795844/figure_002.jpg)
![Fig. 2. (A) Concentration profiles of NO, NH3, N2 and N2O over the V20s;-WO3-TiO; catalyst at a space velocity of 7.41 g! h—!. The inlet concentration of NO and NH; are 500 Vppm; balance He with 2% O>. (B) Concentration profiles of NO, NH3, Nz and NO over the Fe,03— SiO, catalyst at a space velocity of 1601 g~' h”!. The inlet concentration of NO and NH; are 500 Vppm; balance He with 2% O5. Reprinted with permission from [91]. tract the reactant NH; (the case of reactions (7) and](https://figures.academia-assets.com/47795844/figure_003.jpg)
![Fig. 3. Comparison of the conversion of NO in copper samples (%%wt CuO) on various oxide supports. Reprinted with permission from [95]. Several kinetic studies, mostly obtained under “real’’ conditions, have been reported for the SCR reaction. These are based on both merely empirical expressions (e.g. power-law kinetics) and/or mechan- istic approaches (e.g. Langmuir—Hinshelwood or The same features have been reported on catalysts with different active cations [12] like, e.g. on Mn- based catalysts (MnO,—AlO3, MnO,-WO3-AlLO3 [26,96] and MnO,-TiO>, [79]), on a number of Cu- expressions (e.g. power-law kinetics) and/or mechan- Parallel behaviors, with a temperature range with maximum NO conversion upon SCR and the competi- tion of SCR and ammonia oxidation reactions, have been found on any vanadia-based catalyst, like for V,05-ZrO, catalysts [93]. However, very similar behavior has also been reported for catalysts with very different formulations. In Fig. 2, a comparison is shown between the behavior of a V30;-WO3-TiO, catalyst and a Fe.O3—SiO, catalyst [91]. Again, this behavior can be found for supported CuO-based catalysts [12,21,94,95], as shown in Fig. 3.](https://figures.academia-assets.com/47795844/figure_004.jpg)
![Fig. 4. FT-IR spectra of the adsorbed species arising from adsorp- tion of ammonia over a V,0;-WO;/TiO2 sample (WO3=9% (w/w) and V,0; =1.47% (w/w)) and subsequent outgassing at RT (a), 400 K (b), 523 K (c), and 623 K (d). The spectra of the activated catalyst have been subtracted. Reprinted with permission from [133]. The thermal stability of NH3 adsorbed species has also been investigated by FTIR: it has been found that Lewis bonded molecular species are thermally more stable than ammonium ions (Fig. 4) [122]. It has also been reported that water competes with ammonia on](https://figures.academia-assets.com/47795844/figure_005.jpg)


![Fig. 5. FT-IR spectra of the adsorbed species arising from NH; adsorption (20 torr) over CuO-TiO, at (a) r.t. and subsequent outgassing at (b) 373 K, (c) 423 K, (d) 523 K, and (e) 623 K. Reprinted with permission from [19]. G. Busca et al./Applied Catalysis B: Environmental 18 (1998) 1-36](https://figures.academia-assets.com/47795844/figure_008.jpg)


![Fig. 8. Mechanism of the NO—NH; reaction on vanadium oxide catalysts proposed by Inomata et al. [68] in the presence of oxygen. Reprinted with permission from [68](c).](https://figures.academia-assets.com/47795844/figure_011.jpg)
 in the presence of oxygen. Reprinted with permission from [71](b).](https://figures.academia-assets.com/47795844/figure_012.jpg)
 in the presence of oxygen.](https://figures.academia-assets.com/47795844/figure_013.jpg)
![Fig. 11. Mechanism of the NO-—NH; reaction on supported vanadium oxide catalysts proposed by Ramis et al. [123] in the presence of oxygen.](https://figures.academia-assets.com/47795844/figure_014.jpg)
![Fig. 12. Scheme illustrating the catalytic cycle of the SCR reaction over vanadia/titania catalyst in the presence of oxygen proposed by Topsge et al. [173]. Reprinted with permission from [173](c).](https://figures.academia-assets.com/47795844/figure_015.jpg)
![Fig. 13. Scheme illustrating the catalytic cycle of the SCR reaction over Cu-ZSM5 catalyst in the presence of oxygen proposed by Komatsu et al. [29]. Reprinted with permission from [29].](https://figures.academia-assets.com/47795844/figure_016.jpg)
![Fig. 14. Scheme illustrating the mechanism of the NO—NHs3 reaction over Cu-based catalyst in the presence of oxygen proposed by Centi et : [21]. Reprinted with permission from [21]. where NH species are produced by NH; dissociation. This mechanism is, however, only tentative since it is](https://figures.academia-assets.com/47795844/figure_017.jpg)


![the synthesis of esters has been recognized nearly 70 years ago [15]. Enzymes produced by Bacillus sp 3. Industrially used enzymes](https://figures.academia-assets.com/5773889/table_001.jpg)


![diffusion, then (29) takes on a relatively simple form which can be evaluated exactly; this involves extensive manipula- tions which are available from Gelhar and Axness [1981]. The results, are seen to agree, to lowest order in ¢, with the asymptotic results (33) and (36), when a, = az. Figure 1 shows a comparison of the exact and aproximate results; this indi- cates that the approximate solution is adequate for « < 0.01. Note that the ratio of transverse to longitudinal macroscopic dispersion is ¢/3, which will be very small under typical conditions.](https://figures.academia-assets.com/48725868/figure_004.jpg)


![1. The tracer test was either ambient flow with known input, diverging radial flow, or a two-well pulse test (without recirculation). These three test configurations produce break- through curves which are sensitive to the dispersion coefficient and appear to work well in field applications [Welty and Gelhar, 1989]. The radial converging flow test is generally considered less satisfactory than the diverging test because breakthrough curves at the pumping well for the converging test frequently exhibit tailing, which complicates the interpre- tation of these tests. Some researchers attribute this behavior to two or more discrete geologic layers and try to reproduce the observed breakthrough curve by superposition of break- through curves in each layer, where the properties of each layer may differ [e.g., Ivanovitch and Smith, 1978, Sauty, 1977]. The problem with this interpretation is that there are typically numerous heterogeneities on a small scale that cannot be attributed solely to identifiable layers. One possible expla- nation of the tailing in radial convergent tests is sometimes termed ‘‘borehole flushing,’’ where the tail of the breakthrough curve is attributed to the slow flushing of the input slug of tracer out of the injection borehole by the ambient groundwater flaw. Goblet [1982] measured the slow flushing of tracer out of the values that do not fall into the high or low groups. These classifications do not place strict numerical confidence limits on reported dispersivities, but rather are intended to provide an order-of-magnitude estimate of the confidence we place on a given value. In general, we consider high-reliability dispersivity values to be accurate within a factor of 2. Low-reliability values are considered to be no more accurate than within 1 or 2 orders of magnitude. Intermediate reliabil- ity falls somewhere between the extremes. We wish to make a distinction between the judgment of the reliability of the reported dispersivity and the worth of a study. Often, the Purpose of a study was for something other than the deter- mination of dispersivity. Our classification of dispersivity is not intended as a judgment on the quality of a study as 2 whole, but rather to provide us with some criteria with which to screen the large number of data values obtained. By then examining the more reliable data, conclusions which evolve from the data will be more soundly based and alternative interpretations may’ become apparent.](https://figures.academia-assets.com/48725864/table_008.jpg)


![Fig. 8. Scatter plot of January maximum of daily precipitation amount at Chico, CA, USA, vs. January mean pressure. (dependence of the shape parameter on pressure would be permissible as well). Katz and Parlange [54] originally analyzed this same precipitation and pressure data, but for conditional stochastic modeling of the time series of daily precipitation amounts (1.e., not just extremes). The following results can be viewed as an extension of those in Katz [51], in which extreme precipitation was mod- eled conditional on only two pressure states (below or above average).](https://figures.academia-assets.com/51270213/figure_008.jpg)
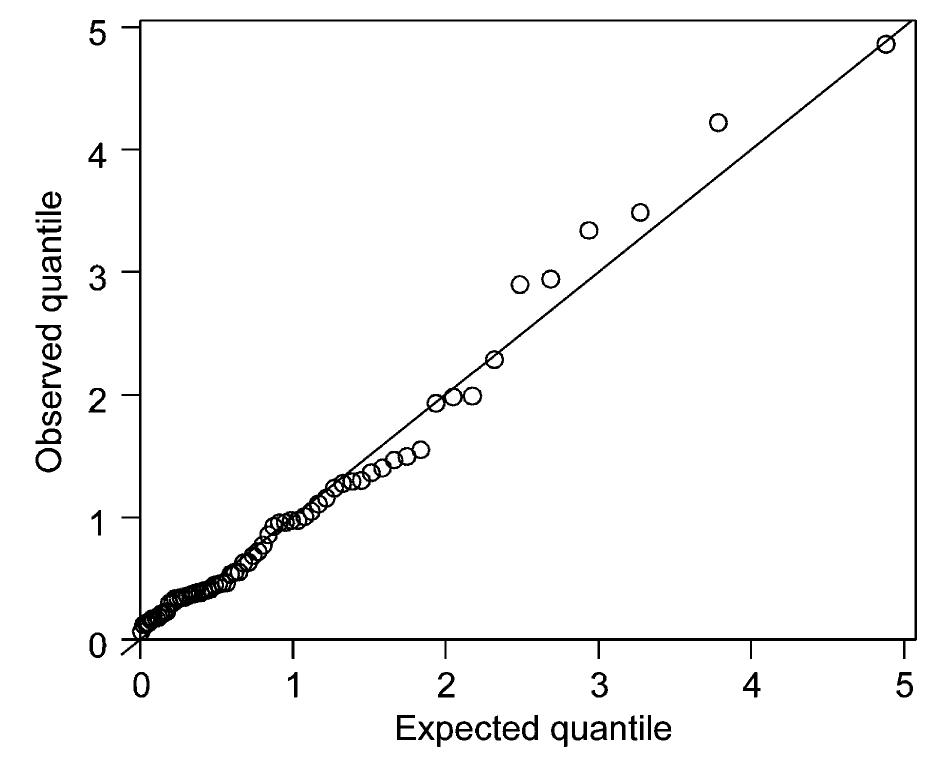
![Fig. 9. Annual peak flow for Salt River near Roosevelt, AZ, USA. 1924-1999. When the GEV distribution is Salt River peak flow data, a rather parame shown) indicates very poor fit for tions (j = 0.677 for penalized 7=0.4 relative for PWM, quite a bit sma y high values). Alternative fitted by ML to the high estimated shape er is obtained (7 = 0.859) and a Q-O plot (not the highest observa- ikelihood [16] and ler than ML but still y, a GP distribution is assumed instead, with ML yielding an estimated shape parameter of = 0.279 (i.e., consistent with that ob- tained by Anderson and Meerschaert [3] for monthly](https://figures.academia-assets.com/51270213/figure_009.jpg)


![Fig. 1. Experimental site. Rectangle within the sand quarry illus- trates the location of the transport experiment and matches the frame of Figure 5 (top). Also shown is the approximate extent of contami- nation from the landfill in 1979, as delineated by a 10 mg/L chloride isopleth. Rectangles 2 and 3 mark the locations of previous smaller- scale tracer tests [Sudicky et al., 1983, and Sutton and Barker, 1985, respectively].](https://figures.academia-assets.com/42228246/figure_001.jpg)


![Fig. 5. Locations of multilevel samplers and injection wells as of January 1986: (top) plan view and (bottom) approxi- mate vertical distribution of sampling points (plus signs) projected onto cross-section AA’ (vertical exaggeration = 4.6). Positions labeled UW-1 and UW-2 are the locations of piezometer nests and core samples discussed in the text. Position labeled UW-3 is the center of a set of 32 cores taken in two intersecting and orthogonal lines by Sudicky [this issue]. Solid vertical lines in the bottom frame indicate the location and screen length of the injection wells.](https://figures.academia-assets.com/42228246/figure_005.jpg)


![Fig. 9. Approximate concentration distributions of chloride (1 and 462 days after injection) along vertical cross section AA’, the horizontal axis of the plume (vertical exaggeration = 3). Contours depicted for the 1- and 462-day plumes are 10, 100, 300, and 600 mg/L and 10, 30, 100, and 300 mg/L, respectively. Figure 9 presents approximate concentration distributions of the chloride plume in vertical sections on or near the longi- tudinal axis of the plume (1 and 462 days after injection). The vertical scale of the figure is exaggerated by a factor of 3 for clarity. Because such vertical representations cannot be pro- Figure 8 shows that the mobility of the carbon tetrachloride is significantly less than that of chloride, providing qualitative evidence of retardation due to sorption. The retardation of the other organic solutes was even greater [Roberts et al., this issue], generally in accord with their hydrophobicity (Table 3).](https://figures.academia-assets.com/42228246/figure_009.jpg)

![TABLE 2. Background Groundwater Characteristics Source one, Nicholson et al. [1983]; results have been converted from mM to mg/L, except for alkalinity. Source two, this study.](https://figures.academia-assets.com/42228246/table_002.jpg)


![Some of the more important industrial applications of immobilized enzyme systems [1-3,5]](https://figures.academia-assets.com/39517314/table_001.jpg)
![Some of the most frequently studied enzymes for enzyme-based biosensors [3,10- 12] Table 2](https://figures.academia-assets.com/39517314/table_002.jpg)


![A great discussion exists nowadays about the oxida- tive pathway, which could be performed by direct hole attack or mediated by HO® radicals, in their free or adsorbed form. The oxidative pathway leads, in many cases, to complete mineralization of an organic sub- strate to CO2 and H20. Generally, A is dissolved Oz, which is transformed in superoxide radical anion (O2°—) and can lead to the additional formation of HO®: ! The values of the standard redox potentials cited in this paper are referred to NHE and taken from [4].](https://figures.academia-assets.com/44533356/figure_002.jpg)


