By N. J. MAYHEW he history of prices in England begins in the thirteenth, or even the T late twelfth century, from which time the data continue more or less unbroken to the present day. This material has been the subject of serious study...
moreBy N. J. MAYHEW he history of prices in England begins in the thirteenth, or even the T late twelfth century, from which time the data continue more or less unbroken to the present day. This material has been the subject of serious study for over a century, and although recent scholarship has refined and improved our knowledge, the broad outlines of the picture have long been clear. At its simplest, the price history of the four or five centuries before 1700 may be described as two periods of marked and prolonged inflation either side of a fifteenth century characterized by stagnant, or even falling prices.' Explanation of these price trends is, however, much less clear than are the data. For much of this century economic historians have debated the relative importance of demographic as opposed to monetary factors affecting prices in England from c. 1300 to 1700. The monetary approach argues that when money becomes plentiful, its value falls, which means that other prices expressed in money must rise. The demographic argument is that a rising population will generate an increased demand for goods, and a rise in demand over supply will lead to a rise in prices. Most work has been rather exclusively either medieval or modern, and either monetary or demographic in its approach. This article will attempt to cover four centuries, and will draw on both demographic and monetary data. The sixteenth and seventeenth centuries have been well served with good summaries of the debate,2 while for the middle ages the best summary is a brief essay by Harvey.3 Happily, recent medieval scholarship tends less towards single factor explanations. Demographers combine a growing mastery of their own discipline with an interest in, and tolerance of, other approaches, while historians of money are more likely to make claims for the importance of their subject than for its pre-emir~ence.~ Rogers, H i s t o r y of agriculture and prices; Beveridge, Prices and wages in England; Phelps Brown and Hopkins, 'Seven centuries of the price of consumables'; Farmer, 'Some price fluctuations'; idem, 'Some grain price movements'; idem, 'Some livestock price movements'; idem, 'Prices and wages'; idem, 'Prices and wages, 1350-1500'; Bowden, 'Agricultural prices'. Outhwaite, Infition in Tudor and early Stuart England; Ramsey, ed., Price revolution in sixteenthcentury England. More recently Challis, Currency and the economy, provides a detailed summary of the evidence of, and questions raised by, the coinage. Harvey, 'Introduction'. Though focusing on the half century or so before the Black Death, the issues raised are relevant for the whole of the later middle ages. Collected volumes of the essays of some of the chief protagonists are available: Postan, Medieval agriculture; idem, Medieval trade and finance; Day, M e d k a l market economy; Munro, Bullion flows and mmuuzry policies. Smith, 'Demographic developments'; Spufford, Money.


![Note: The table reports coefficients and standard errors corrected for clustering (in parentheses). Age trends have been removed from
all outcomes. All outcomes are then standardized by subtracting the mean and dividing by the standard deviation of the control
group. For the Denver, the sample includes children between the ages of 0 and 83 months; for the TVIP, McCarthy memory test, and
the BPI the sample includes children between the ages of 36 and 83 months. For the Denver test, the dependent variables are defined
in terms of the number of delays plus cautions. Standard errors correct for clustering at the community level. AGE] refers to
children aged 0-35 months, AGE2 refers to children aged 36-59 months, and AGE3 refers to children aged 60-83 months. The F-test
in the middle panel reports the p-value on a test of equality of the coefficients on (T*girl) and (T*boy). The F-tests in the lower
panel reports the p-value on the following tests: F-test 1 tests of equality of the coefficients on (T*AGE1) and (T*AGE2), F-test 2
tests of equality of the coefficients on (T*AGE2) and (T*AGE3), and F-test 3 tests of equality of the coefficients on (T*AGE1) and (T*
Table 5: Heterogeneity of treatment effects by child gender and age](https://figures.academia-assets.com/46064901/table_005.jpg)


![Figure 1. Flowchart of dependencies between data sources and computation of the water scarcity index. Sources indicated in the flowchart are as follows: 1, Lehner and Doll [2004]; 2, International Commission on Large Dams [2003]; 3, World Water Assessment Programme (WWDR-II, http:/Avwdrii.sr-unh.edu/); 4, Mitchell and Jones [2005]; 5, Kallberg et al. [2005]; 6, New et al. [1999]; 7, Siebert and Doll [2008]; 8, Portmann et al. [2008]; 9, EROS, USGS (Global land cover characteristics data base, version 2.0, http:// edcdaac.usgs.gov/glec/globedoc2_0.html); 10, Food and Agriculture Organization of the United Nations (http://www. fao.org/ag/AGA info/resources/en/glw/GLW_dens.html) and Environmental Research Group Oxford (http://ergodd.zoo.ox.ac.uk/); 11, MLIT [2007]; 12, World Bank [2006, 2007; country classification, http://web.worldbank.org]; 13, FAO AQUASTAT database (http://www. fao.org/nr/water/aquastat/data/); 14, International Groundwater Resources Assessment Centre (http://www. igrac.nl/).](https://figures.academia-assets.com/45534086/figure_001.jpg)

![Figure 3. Nonrenewable groundwater abstraction for the year 2000 [after Wada et al., 2010].](https://figures.academia-assets.com/45534086/figure_003.jpg)

![Figure 5. Comparison between simulated net blue water demand for livestock and irrigation (y axis) and reported agri- cultural water withdrawals (x axis) per country. Reported values are taken from the FAO AQUASTAT database over the period 998-2002. X error bars are based on the estimated agricultura water withdrawal for 90 developing countries by FAO com- pared to the observed value reported to the AQUASTAT data- base [Food and Agriculture Organization, 2008]. Simulated values are representative for the year 2000. Y error bars are based on the range in net irrigation blue water demand due to variations in green water availability over the simulation period 1958-2001. Selected countries are identified by their ISO country codes.](https://figures.academia-assets.com/45534086/figure_005.jpg)


![“These data are based on FAO AQUASTAT, the work of Gleick et al. [2006], and the Pacific Institute’s The World’s Water Web site (http://www. worldwater.org/data.html). Domestic sector, comprising households and municipalities. “GDP per capita is based on the year 2000/2001 (year 2000 U.S. dollars, World Bank). ‘GDP per capita of low income countries is less than US$755, and the average GDP per capita of these countries is US$359. “GDP per capita of middle income countries is between US$756 and US$9265, and the average GDP per capita of these countries is US$2843. ‘GDP per capita of high income countries is more than US$9266, and the average GDP per capita of these countries is US$21,880. Table 2. Population and Water Withdrawal by Sector per Continent and Classified by GDP per Capita for the Year 2000°*](https://figures.academia-assets.com/45534086/table_002.jpg)
![“Per class, population is given in billions, and the corresponding fraction of the total population is in percent. >Year indicates the year of the population figure used for the estimates. “Temporal resolution refers to the aggregation level of demand and availability. In the case of Hanasaki et al. [2008b] the aggregation was on a dail value over the period 1986-1995; this study used monthly mean values over the period 1958-2001. “Approximately 200 million people were unallocated on the global scale. “Transport factor a was set to 0.0 in the watershed-based estimate so that no upstream water was available to downstream reach along the river network ‘Assessed by means of the cumulative withdrawal to demand ratio (CWD), which assesses the fulfillment of the demand on a subannual basis, divide into equivalent categories of no stress, medium stress, and high stress on the basis of WSI < 0.2, WSI < 0.4, and WSI = 0.4, respectively. Shown are tk values including both the effects of environmental flow and the reservoir operation scheme that are the most compatible with this study. Table 3. Global Assessments of World Population Experiencing Blue Water Stress*](https://figures.academia-assets.com/45534086/table_003.jpg)


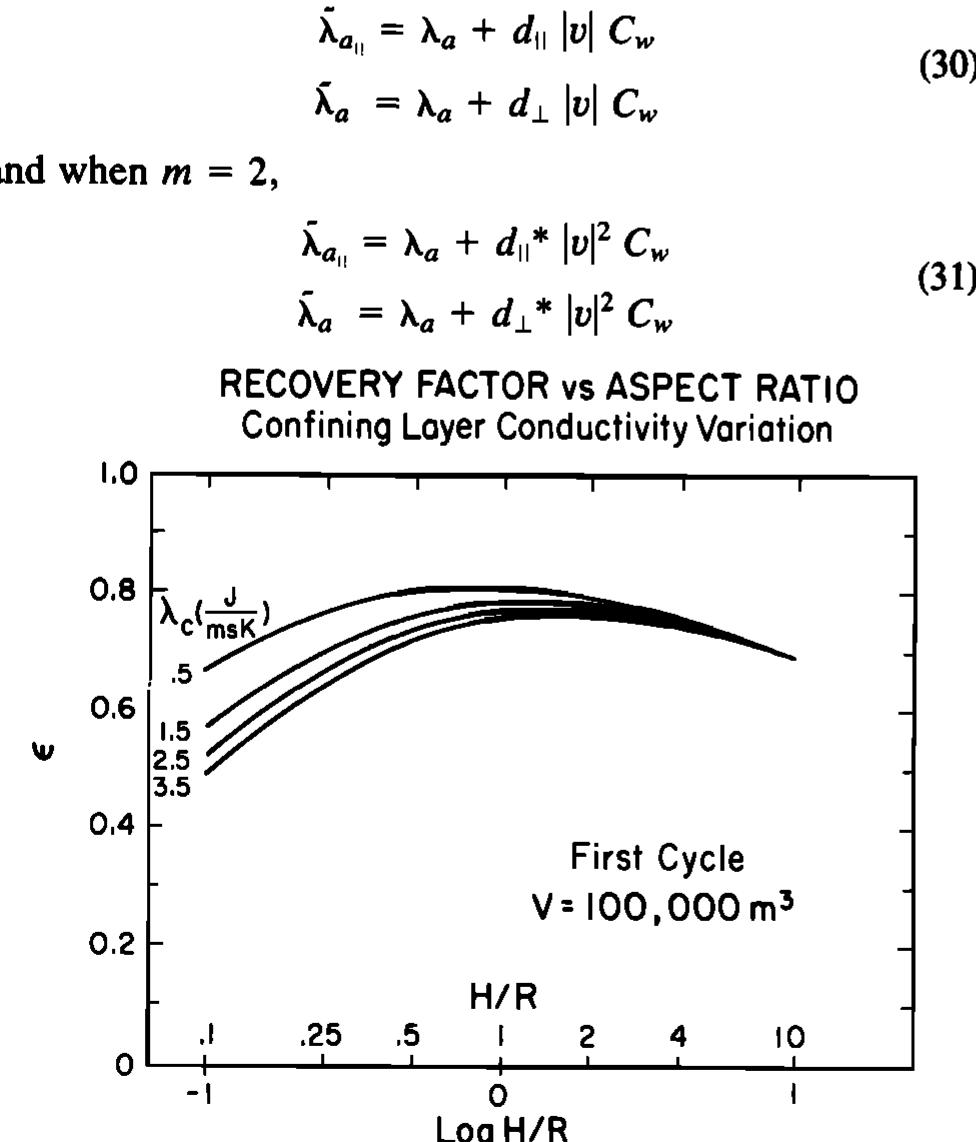
![Fig. 8. Recovery factor for different thermal volumes for the first five cycles and first cycle production temperature versus time for different thermal volumes. 3.2.1. Velocity-dependent dispersion. During periods when the water flows through the aquifer there is, in addition to ordinary heat conduction, a dispersion of heat due to the velocity distribution across each flow channel, the irregular- ity of the pore system, and large-scale aquifer heterogene- ities. According to the theory for dispersion of a nonadsor- bent tracer in uniform porous media [Scheidegger, 1960], the dispersion is proportional to |v,|”, where v, is the pore velocity. The value of m ranges from 1 to 2. When m is 1, the molecular transverse diffusion between adjacent streamlines can be neglected, and when m is 2, the transverse diffusion is important. The transverse diffusion becomes more important as pore velocity decreases. The thermal conductivity of the stagnant liquid-solid mixture and the heat dispersion may be combined to form an effective thermal conductivity. Gener-](https://figures.academia-assets.com/46885808/figure_010.jpg)